

Bitcoin Bounce Fades, Q1 Losses Deepen, and New Price Risk Back in Focus
Bitcoin is trading around $68,700, down nearly 22% year to date and on pace for its weakest first quarter since 2018. After starting the year near $87,700, BTC has shed almost $20,000 in just a few weeks, putting pressure on the broader crypto market.
While early-year weakness is not unusual for Bitcoin, the scale of the decline has raised concerns that the current correction may not be over yet.
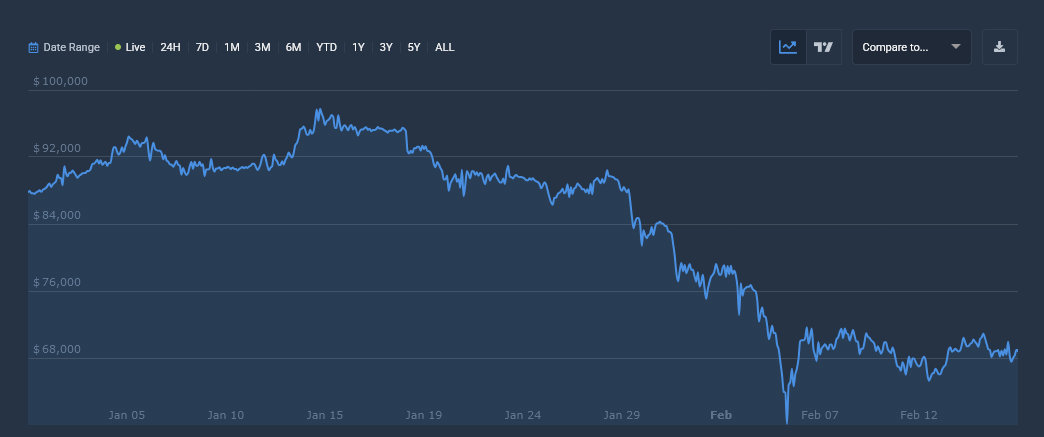 Bitcoin Price Chart in 2026 So Far. Source: CoinCodex
Worst First Quarter in 8 Years?
Historically, Bitcoin has posted a negative first quarter in 7 of the past 13 years.
However, a 22% drawdown would mark its worst Q1 performance since the 2018 bear market, when BTC plunged nearly 50% in the opening months of the year.
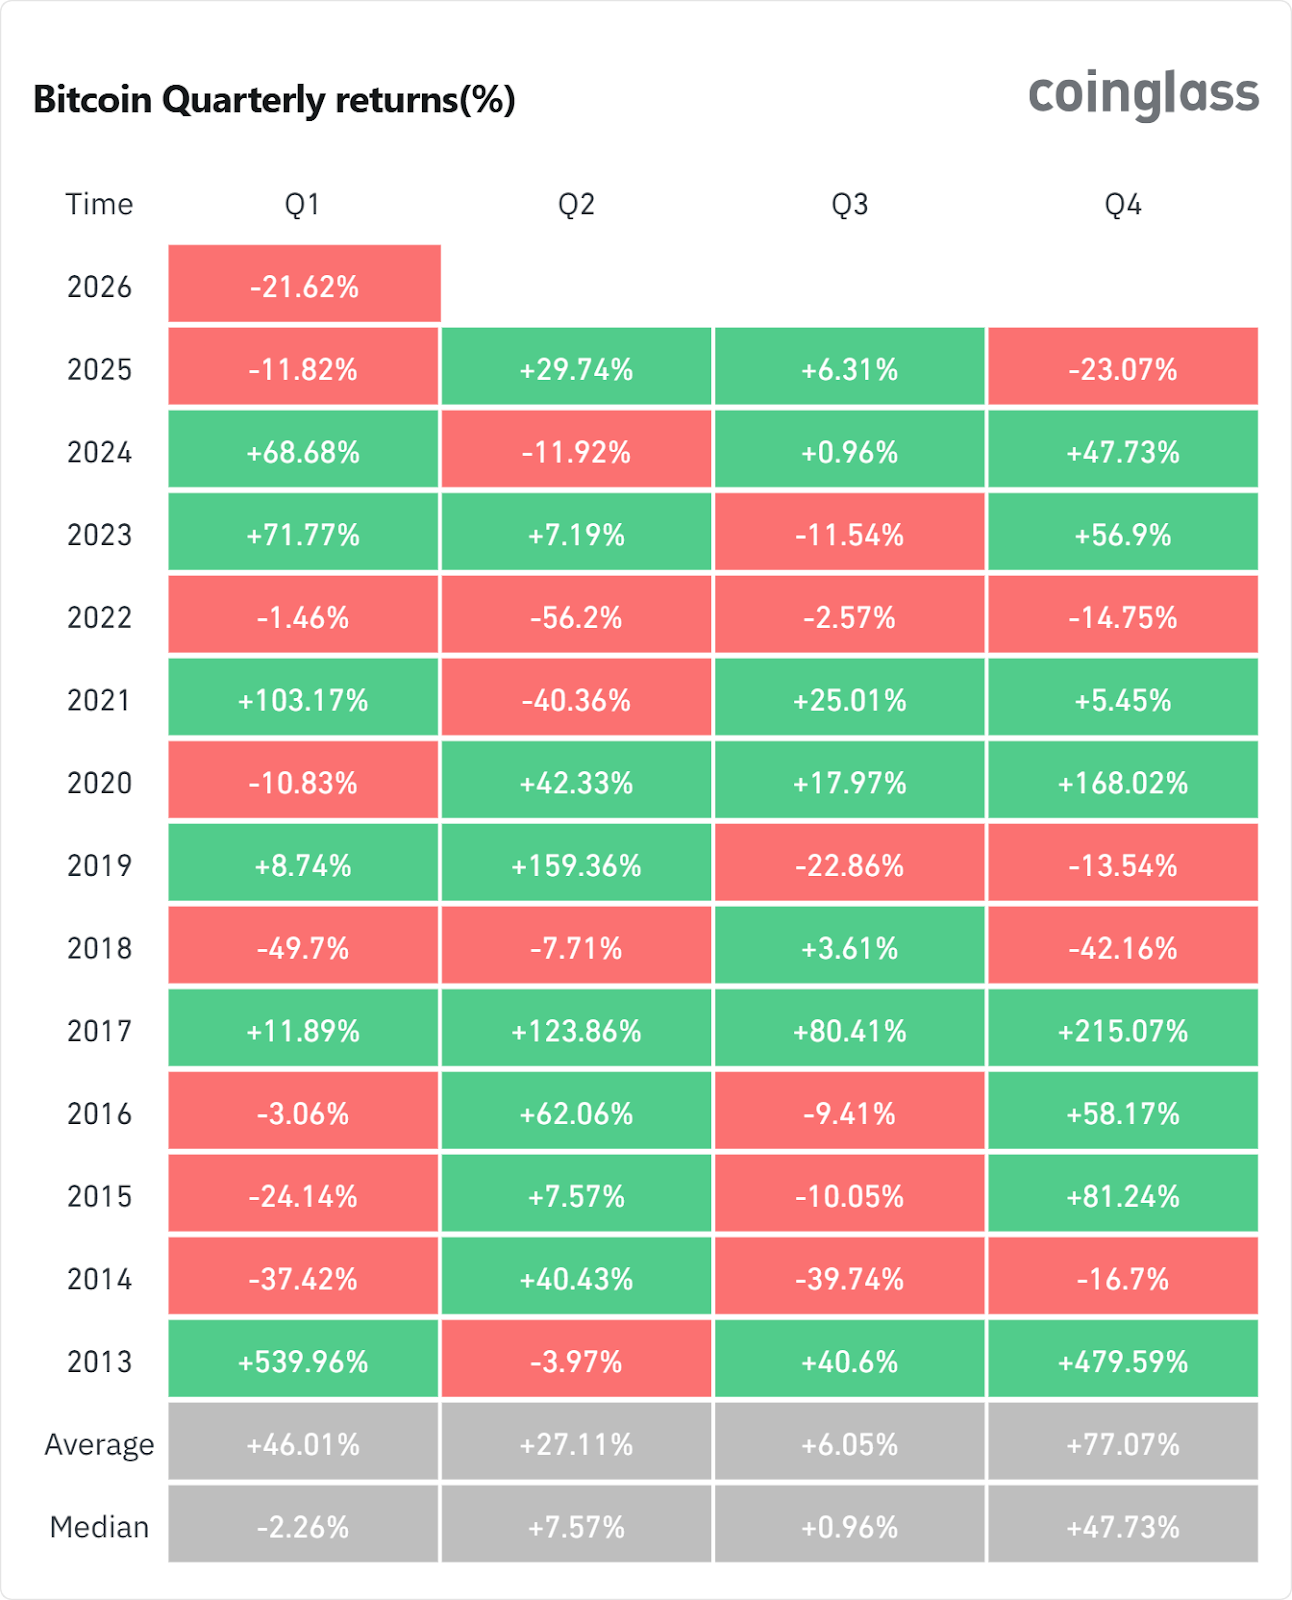 Bitcoin quarterly returns. Source: CoinGlass
January and February both closed in the red, increasing the likelihood of a rare back-to-back negative start.
To meaningfully shift the narrative, Bitcoin would need to reclaim the $80,000 region, which currently appears distant given prevailing momentum.
That said, history shows that weak first quarters do not necessarily define the full year. In eight of the past thirteen years, Q2 delivered the opposite performance of Q1.
This keeps the medium-term outlook more nuanced than the headlines suggest.
9% Bounce May Have Increased Downside Risk
Between February 12 and February 15, Bitcoin staged a sharp 9% rebound. On the surface, the move appeared constructive. Underneath, leverage data tells a different story.
Open interest in BTC futures jumped from roughly $19.6 billion to $21.47 billion during the rebound, an increase of nearly $1.9 billion.
Funding rates also turned strongly positive, signaling that traders were aggressively positioning for further upside.
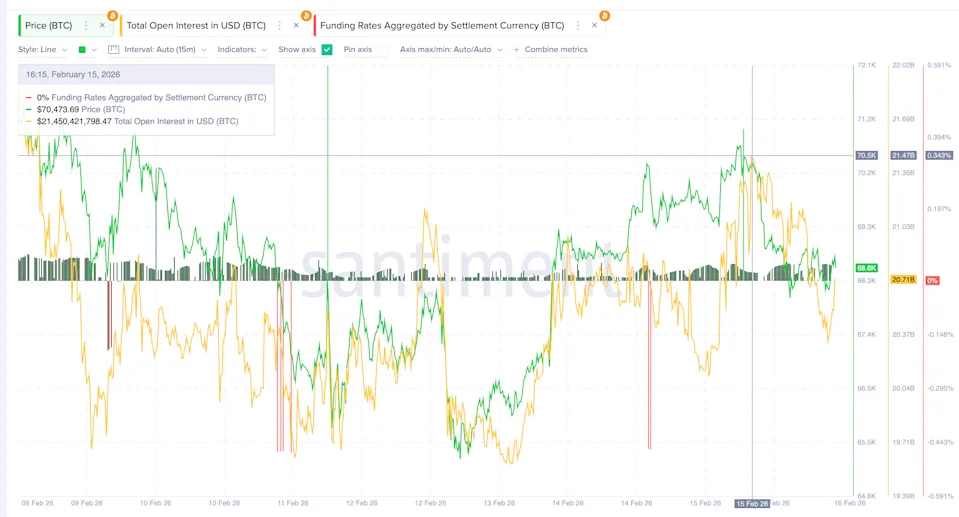 Rising BTC leverage: Santiment
However, the broader chart structure still resembles a bear flag. The recent rally unfolded within a downward continuation pattern, and price is now drifting back toward the lower boundary of that structure.
Momentum indicators add to the caution. A hidden bearish divergence formed on the 12-hour chart, with price making a lower high while RSI printed a higher high. This pattern often appears when sellers are quietly regaining control.
At the same time, Bitcoin’s Net Unrealized Profit/Loss surged by roughly 90% over several days, indicating that many holders quickly returned to paper profits.
Similar profit spikes in early February preceded a 14% drop. If traders rush to lock in gains again, selling pressure could accelerate.
Key Levels: $66K Support, $58K Downside Target
Technically, the $66,270 area is a critical near-term support. A confirmed breakdown below this zone would activate the bear flag continuation pattern.
If that happens, the next major downside target sits near $58,800, aligning with the 0.618 Fibonacci retracement and representing roughly a 14% decline from current levels.
A deeper extension could bring the $55,600 region into play.
On the upside, BTC needs to reclaim $70,840 to stabilize short term. A stronger breakout above $79,290 would invalidate the bearish structure and signal that buyers have regained control.
Bitcoin Dominance and Treasury Companies Offer Mixed Signals
Beyond price action, broader market metrics paint a complex picture. Bitcoin dominance remains elevated near 58.5%, suggesting capital continues to favor BTC over altcoins during this correction. That relative strength often appears in defensive market phases.
Meanwhile, public Bitcoin treasuries continue to hold substantial Bitcoin reserves. Data from BitcoinTreasuries shows over 1.13 million BTC collectively held by public firms, led by large corporate holders.
The largest of these holders is Strategy, which holds 3.27% of the total Bitcoin supply. While this structural demand does not prevent short-term volatility, it reinforces Bitcoin’s long-term institutional footprint.
Bitcoin is caught between historical resilience and near-term technical weakness.
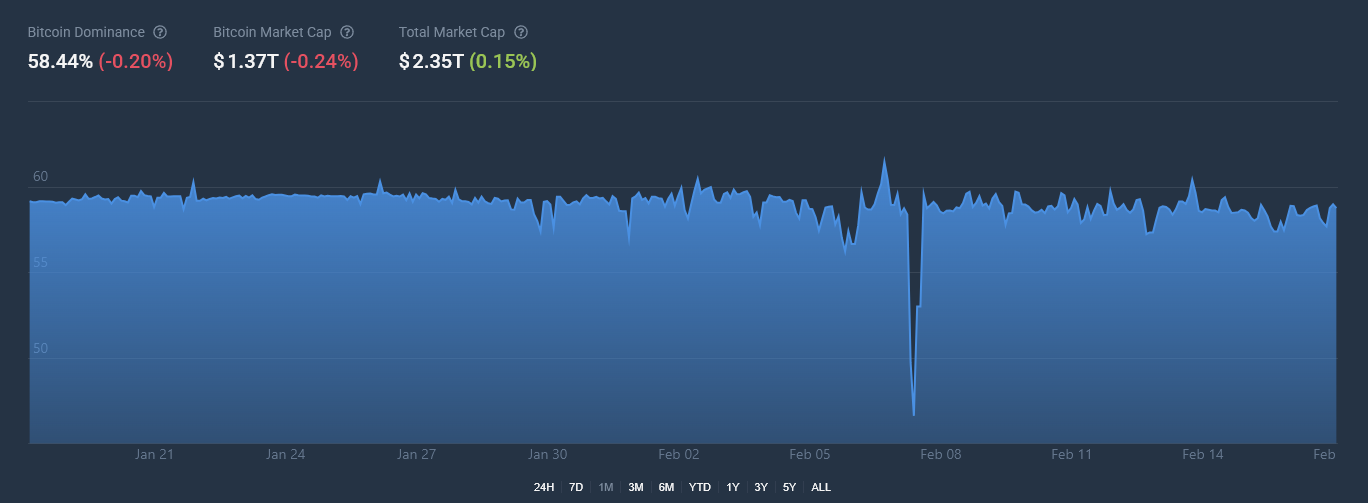 Bitcoin Dominance Over the Past Month. Source: CoinCodex
The 22% year-to-date drop puts Q1 on track for an unenviable record.
Meanwhile, leverage, divergence signals, and on-chain profit metrics suggest that downside risk toward $58,000 cannot be ruled out.
At the same time, elevated dominance and continued corporate accumulation highlight that the broader structure is under pressure, but not yet broken.
The coming weeks will likely determine whether this is simply another rotational phase within a larger cycle or the start of a deeper corrective leg.


You May Also Like

Iran’s drone threat persists despite US strikes, endangering Kuwait’s water facilities

Argentine Banks Test JPM Coin as Central Bank Reviews Crypto Ban: Report


