

Bitcoin Price Prediction: BTC Breaks Resistance at $70k as Bullish Momentum Returns
Bitcoin Price Reclaims $70,000 as Macro Sentiment Shifts
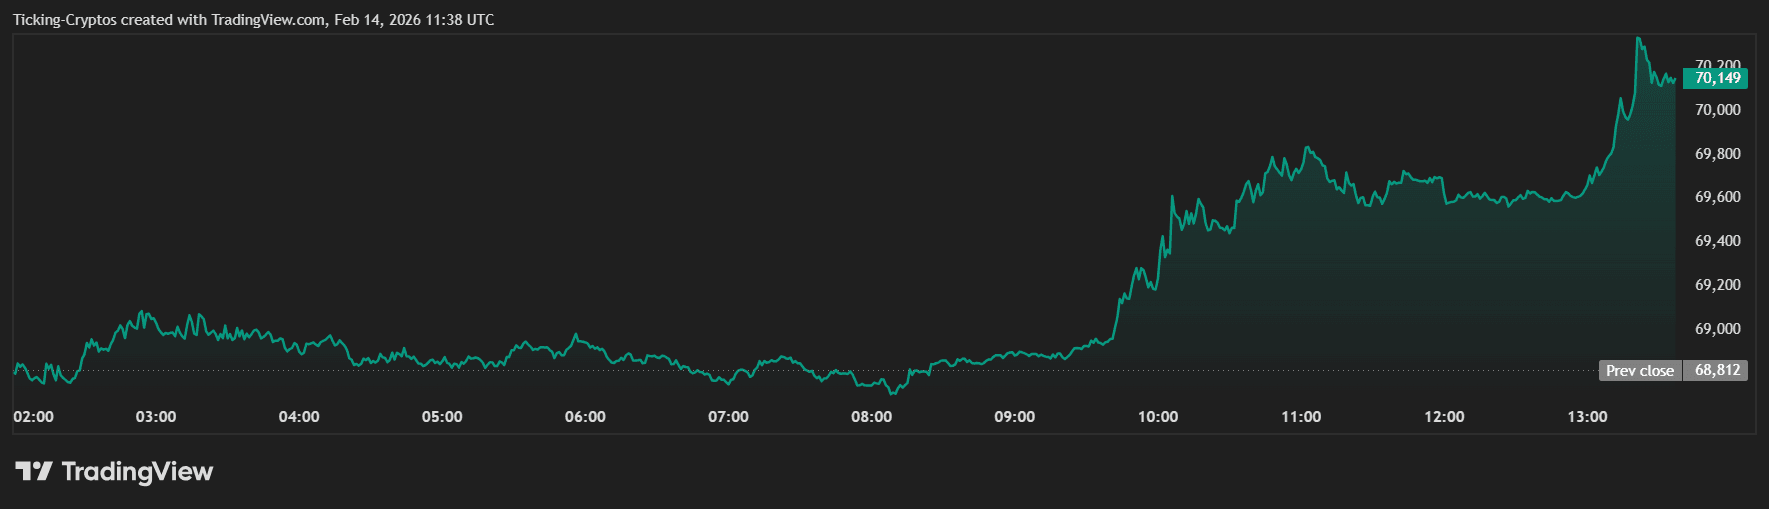
Bitcoin ($BTC) has successfully breached the $70,000 resistance level this Saturday, February 14, 2026, marking a significant psychological victory for the bulls. After a turbulent start to the month that saw prices dip toward $60,000, the leading cryptocurrency has staged a V-shaped recovery, fueled by cooling inflation data and a massive "short squeeze" in the derivatives market.
 Bitcoin price up in USD - TradingView
This move marks a shift in the short-term narrative. While the previous weeks were dominated by "extreme fear" (with the index hitting a low of 5), the reclaim of $70k suggests that buyers are stepping back in to capitalize on a more favorable macroeconomic backdrop. Investors are now closely watching if Bitcoin can flip this former resistance into a solid support floor.
Why is Bitcoin Price Rising Today?
The primary driver for today's rally is the latest U.S. Consumer Price Index (CPI) report released on February 13. The data showed inflation slowing to 2.4%, coming in lower than the 2.5% market expectation.
- Fed Pivot Hopes: Lower inflation increases the probability of the Federal Reserve cutting interest rates sooner than expected. Historically, Bitcoin thrives in high-liquidity environments where borrowing costs are lower.
- Deleveraging Reset: The earlier February crash flushed out billions in over-leveraged long positions. With "cleaner" order books and aggregate open interest stabilizing around $31 billion, the current move is driven more by spot demand and organic exchange volume.
- Correlations: BTC is currently showing a strong positive correlation (+0.6) with U.S. tech stocks (Nasdaq 100). As equities rally on the inflation "miss," Bitcoin is following suit as the ultimate high-beta risk asset.
Bitcoin Price Analysis: BTC/USD Breakout Confirmed?
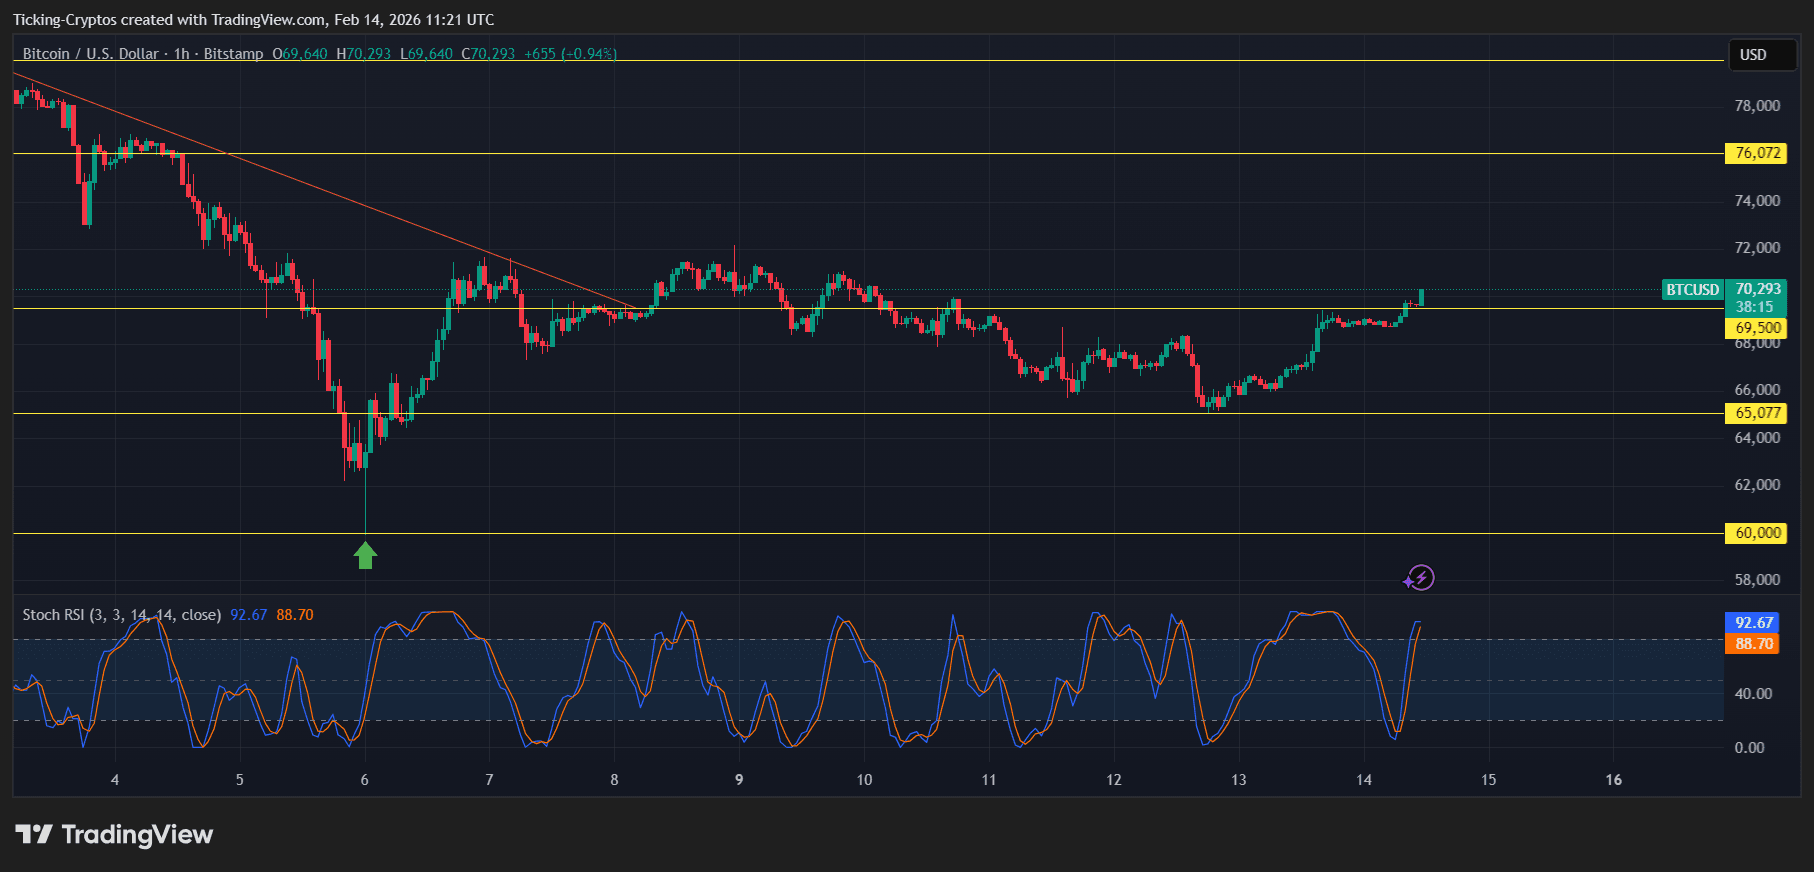
Looking at the 1-hour chart provided by TradingView, the technical structure has turned decisively bullish. After weeks of being trapped under a red descending resistance line, BTC has finally punched through.
 BTC/USD 1H - TradingView
Key Chart Observations:
- The Breakout: Bitcoin is trading at $70,293, having cleared the immediate hurdle at $69,800.
- Momentum Indicators: The Stochastic RSI is currently in the overbought zone at 92.67. While this confirms intense buying pressure, traders should be wary of a potential "retest" of the $69,500 level to confirm it as support.
- The "Golden Pocket": If BTC maintains its position above the $70,000 mark, the next target is the liquidity cluster near $74,750, followed by major resistance at $76,072.
"Closing the daily candle above $71,000 is critical. If successful, it would invalidate the bearish 'dead cat bounce' narrative and set the stage for a run toward $80,000." — Technical Analyst Perspective
Bitcoin Future Targets: Can BTC Hit $100,000 in 2026?
Despite the current rally, major institutions remain divided on the long-term outlook for the year.
- Standard Chartered: Recently revised its end-of-year target from $150,000 to $100,000, warning that while the long-term trend is up, the road will remain volatile due to potential ETF outflows.
- JPMorgan: Maintains a more optimistic stance, viewing Bitcoin as "Digital Gold" with a fair value target near $170,000 based on volatility-adjusted models compared to gold.
Bitcoin Price Prediction and Key levels
| Level Type | Price Target | Market Implication |
|---|---|---|
| Major Resistance | $76,072 | Breakout here confirms new all-time high attempt |
| Immediate Resistance | $71,200 | Consolidation zone for the weekend |
| Primary Support | $69,500 | Must hold to keep bullish momentum alive |
| Macro Floor | $60,057 | The February "Bottom" |


You May Also Like

MAGA candidate torn apart for making racist comment

USD/CHF Price Forecast: Bullish Piercing Pattern Emerges, Traders Eye 0.7900 Resistance
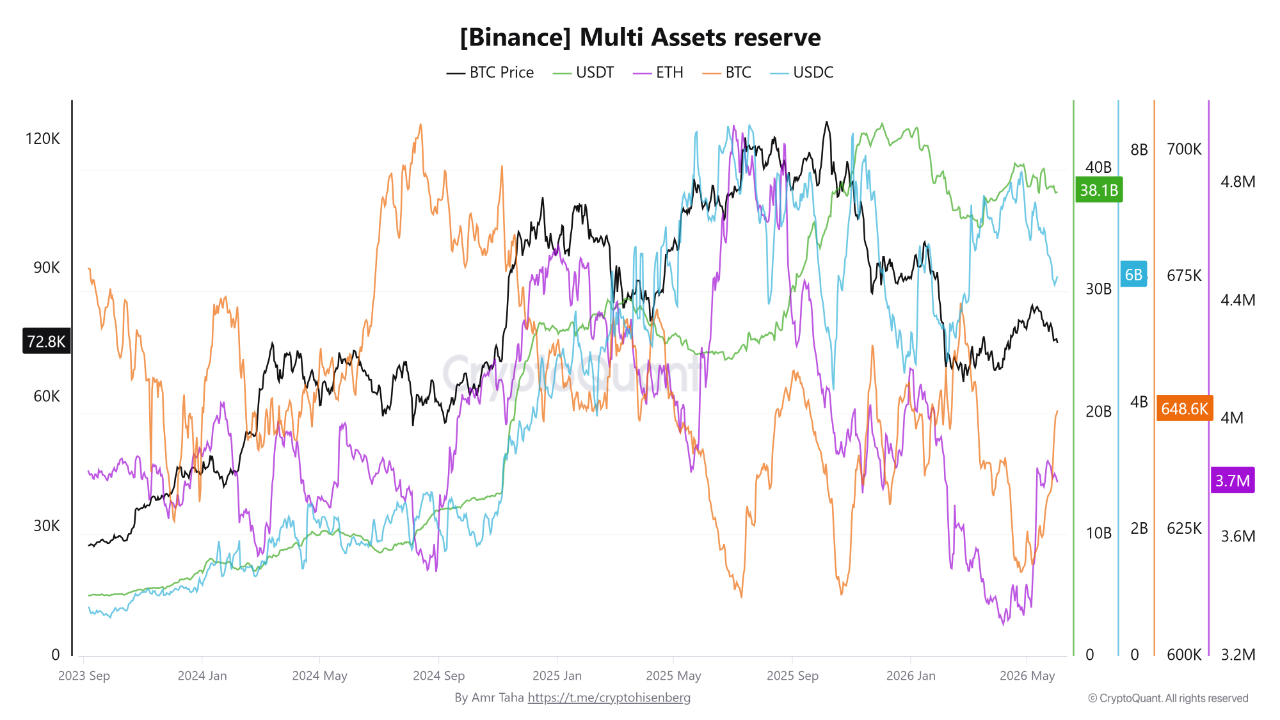
Binance Bitcoin Reserves Surge 5.1% While Stablecoin Liquidity Shrinks $3.87B, Pushing BTC Below $71K


