

Bitcoin Bears Take Control — Key $110K Barrier Shattered
Bitcoin’s price has slipped under the $110,000 mark for the first time in 47 days. Bears currently have the upper hand, with the top crypto asset struggling to regain its footing after the latest string of pullbacks.
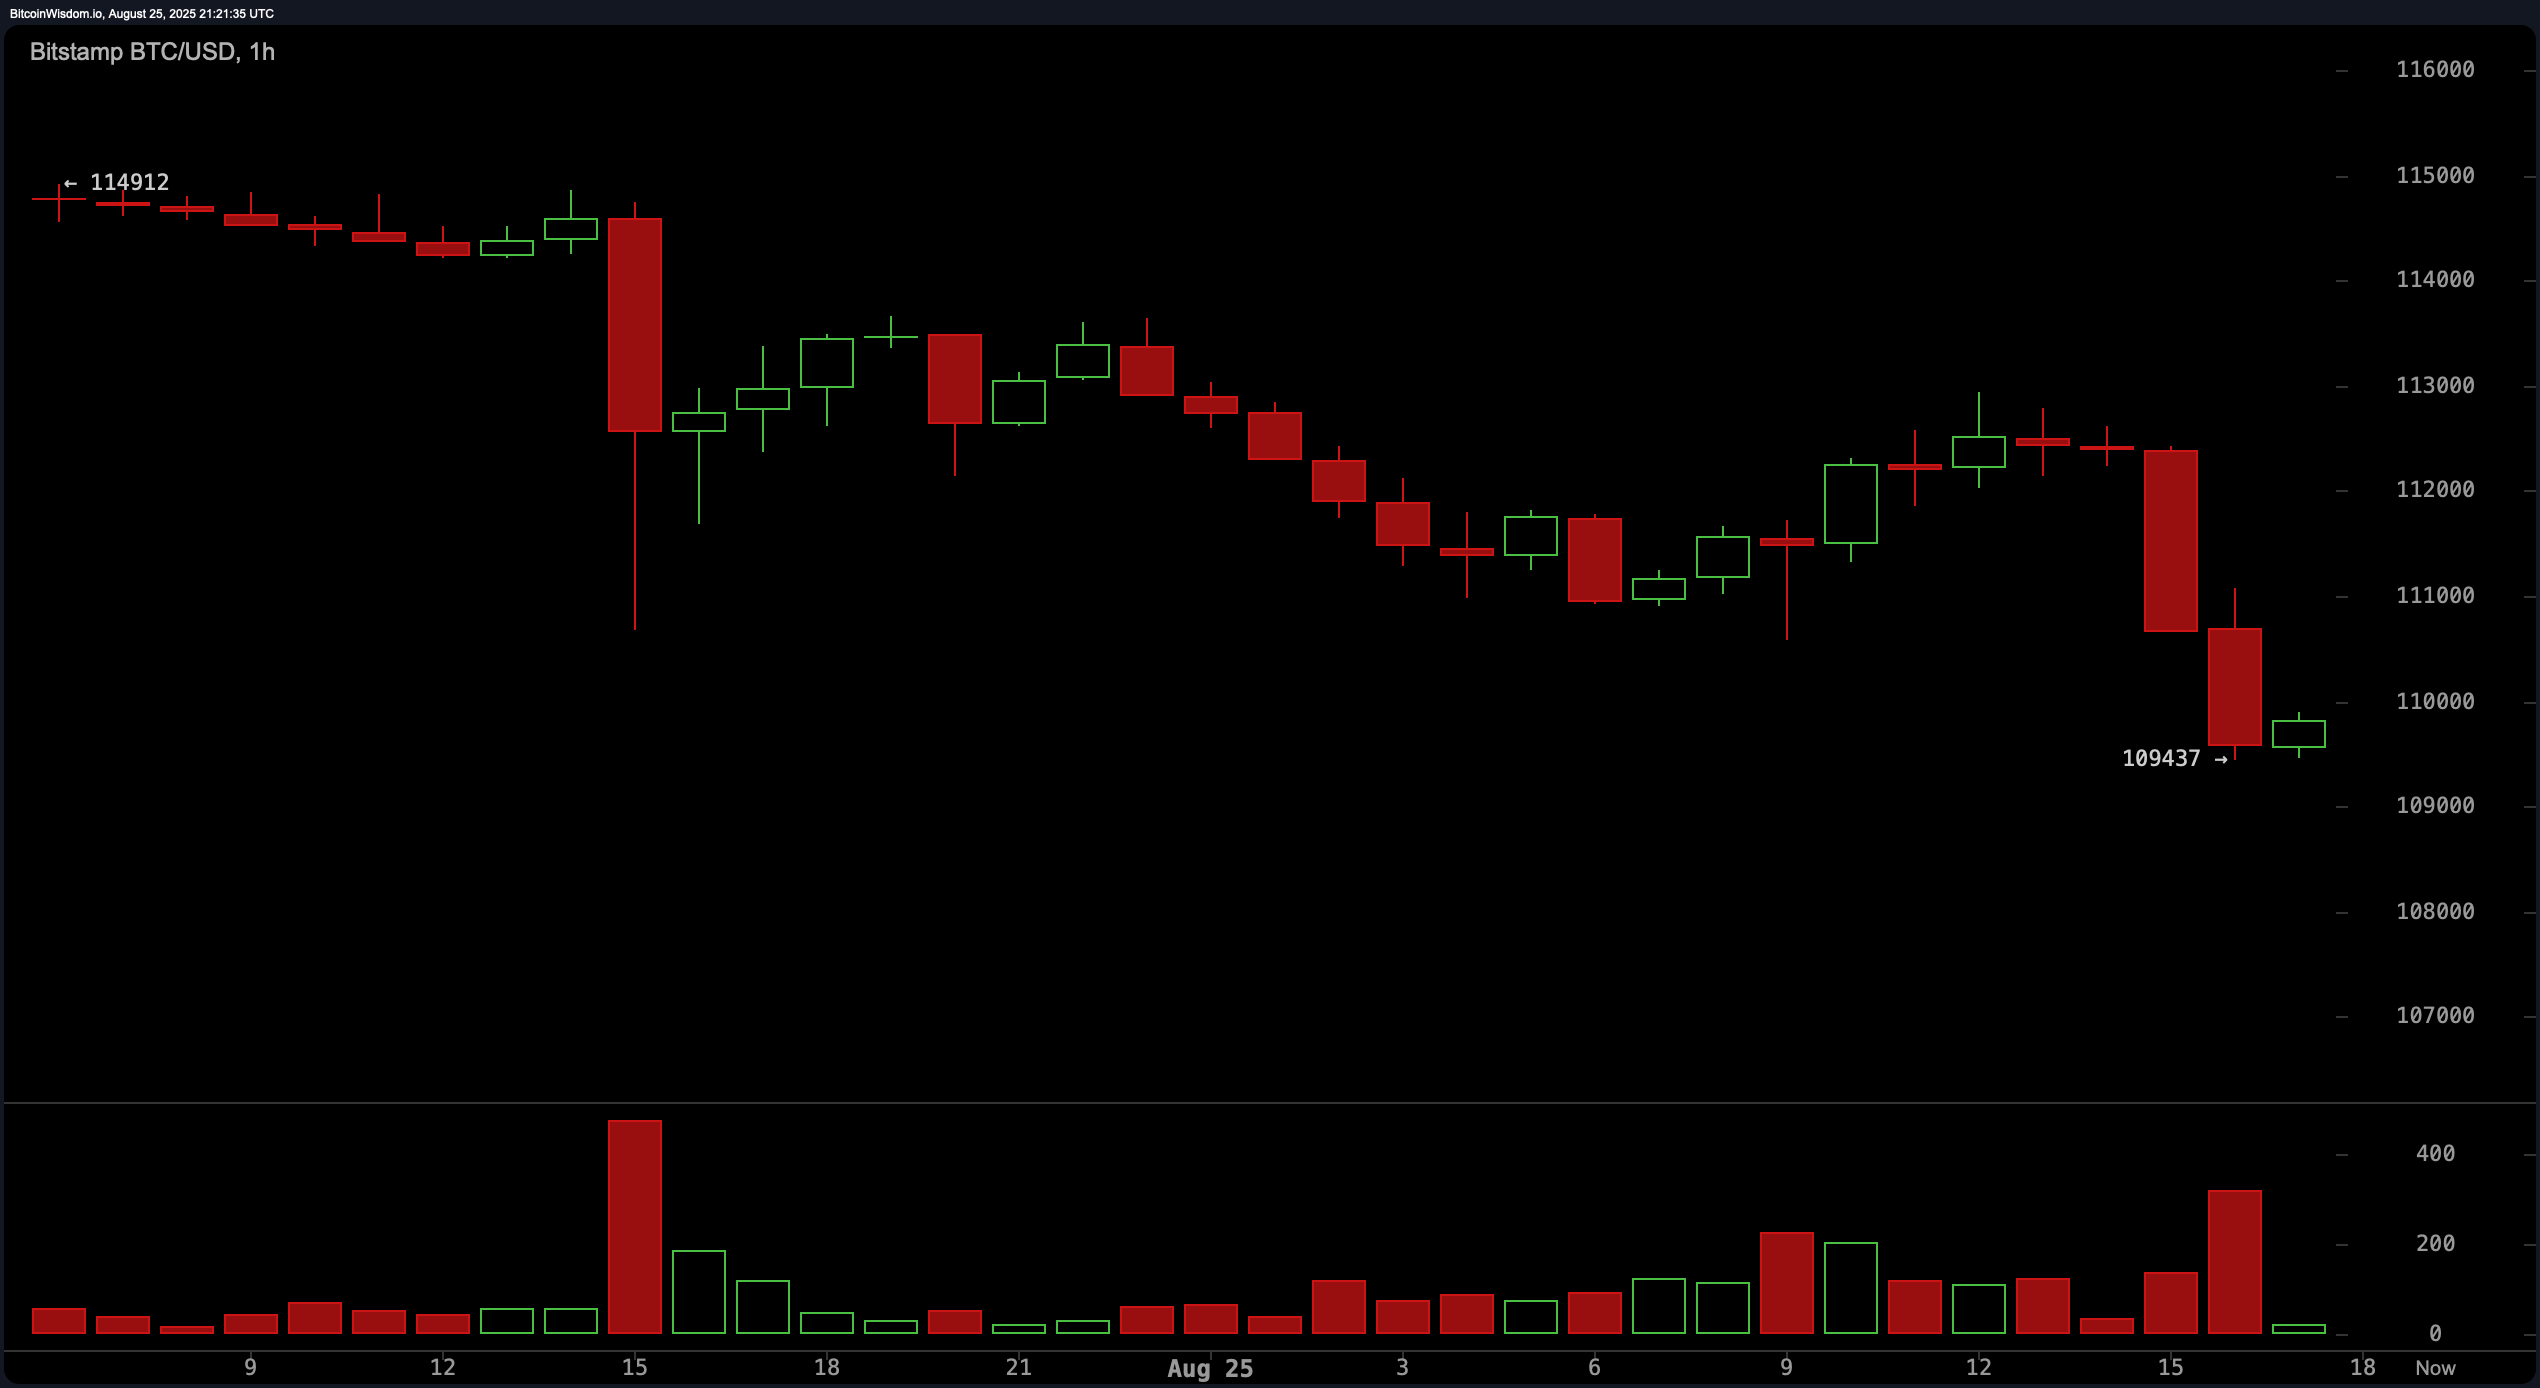
Bitcoin Crashes Below $110K — $186M Liquidated in 24 Hours
Bitcoin’s week has been rocky, slipping 5.7% against the U.S. dollar since Aug. 18. By Monday afternoon, around 4 p.m. Eastern time, the top crypto slid from the $112,000 range to under $110,000. An hour later, BTC traded at $109,465, a 2.6% daily drop.
Some point to whale activity as the culprit, with one massive holder unloading 24,000 BTC on Sunday evening. Others blame the decline on exchange-traded fund (ETF) outflows and broader institutional sell-offs weighing down the market. The slump has rippled across altcoins and derivatives markets, with $895.28 million wiped out in liquidations in just 24 hours.
Of that total, $809 million came from long positions, including $287 million tied to ETH longs and $186 million from BTC longs. Out of those BTC long positions, $95 million were liquidated after the crypto asset slipped under the $110,000 threshold.
The $110,000 level serves as both a key resistance and a psychological barrier for BTC, and slipping beneath it hands the advantage to the bears. Momentum indicators and the moving average convergence divergence (MACD) oscillator are both signaling bearish pressure.
On the daily chart, every moving average has been broken, except for the exponential and simple moving averages, holding at the 200-day trendline. A decisive bitcoin price drop below that zone — spanning $103,689 on the EMA and $100,859 on the SMA — could spell disaster for BTC’s price and jeopardize the broader bull run.


You May Also Like

Bitcoin at Crucial Pivot Point, Here's Why Fed Can Tilt Balance

PW Alliance: A Trusted Name in Crypto Management with a Clear New Mission


