

Validating Hyperparameters and a Weekly Re-training Strategy for DRL Option Hedging
Table of Links
Abstract and 1. Introduction
-
Deep Reinforcement Learning
-
Similar Work
3.1 Option Hedging with Deep Reinforcement Learning
3.2 Hyperparameter Analysis
-
Methodology
4.1 General DRL Agent Setup
4.2 Hyperparameter Experiments
4.3 Optimization of Market Calibrated DRL Agents
-
Results
5.1 Hyperparameter Analysis
5.2 Market Calibrated DRL with Weekly Re-Training
-
Conclusions
Appendix
References
5 Results
5.1 Hyperparameter Analysis
The first experiment analyses the impact of actor learning rates, critic learning rates, and training episodes. Table 3 summarizes the mean and standard deviation of hedging P&L for 1 and 3% transaction cost rates. For comparison, note that the table also lists the BS Delta performance. The binomial tree hedge is not listed as it is worse than the BS Delta under both 1 and 3% transaction costs. Note that the italicized and underlined results are for agents that outperform the BS Delta in both mean and standard deviation, under both 1 and 3% transaction costs.
\ 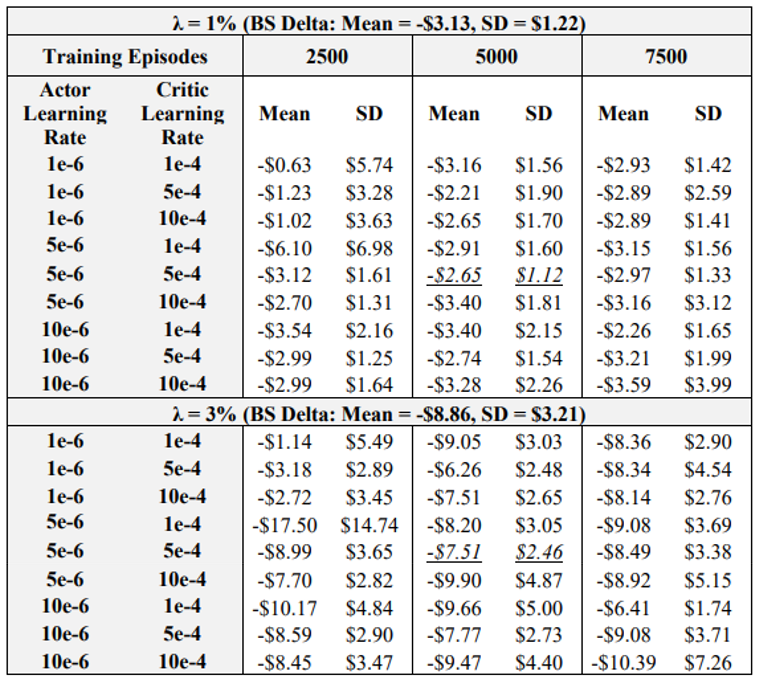
\ The results show that the actor learning rate – critic learning rate – episode combination of (5e-6, 5e-4, 5000) is optimal, outperforming the BS Delta in terms of mean and standard deviation of final P&L under both 1 and 3% transaction costs. The results of Table 3 also gives other key insights into the impact of learning rates and episodes. Take for example the case of low learning rates and low episodes, i.e., combinations of (1e-6, 1e-4, 2500) and (1e-6, 5e-4, 2500). Table 3 shows that these agents perform well in terms of achieving high mean final P&L’s, but standard deviation results are not desirable. This indicates that given the low learning rates and episodes, the agents do not learn a consistent hedging strategy that yields the desired low standard deviation. Now take for example cases wherein learning rates and episodes are at the high end, i.e., a combination of (10e-6, 5e-4, 7500). These agents do not outperform the BS Delta mean or standard deviations in any cases. As such, it is likely that due to the high rate of learning and higher number of training episodes, the training environment becomes unstable. These results illustrate that keeping the learning rates and episodes in a middling range such as (5e-6, 5e-4, 5000) is yields satisfactory performance, beating Delta in mean and standard deviation at both 1 and 3% transaction costs. However, when the critic learning rate is kept low (i.e, 1e-4), increasing the number of episodes often leads to improved performance, as one would expect. This is observed by the combination of (10e-6, 1e-4, 7500), which is considerably better than the (5e-6, 5e-4, 5000) at 3% transaction costs, and has a lower mean at 1% transaction costs. These results suggest that if one can find an optimal learning rate combination for the given problem, increasing the number of episodes will further the learning of the DRL agent and an improved policy will result.
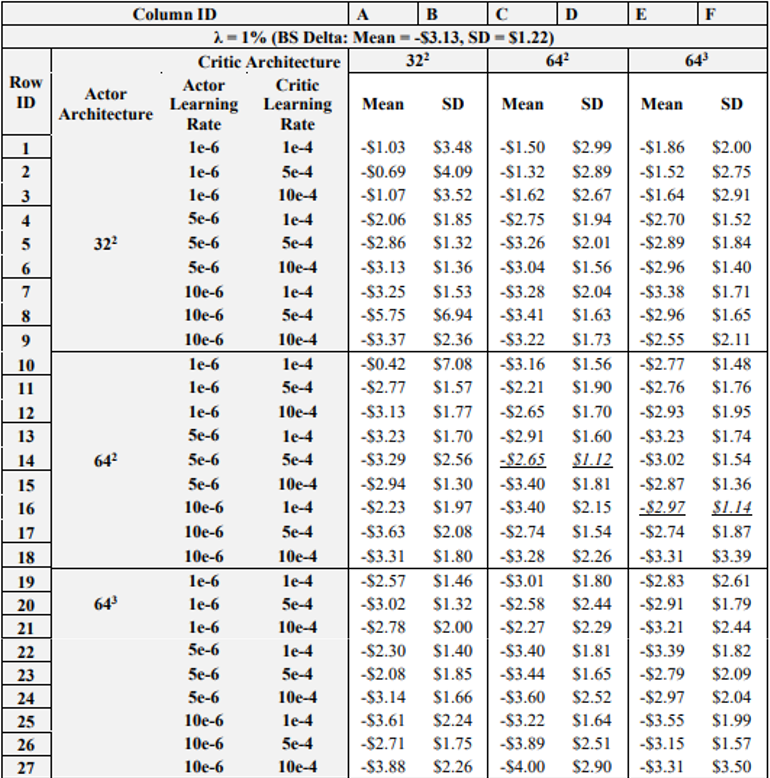
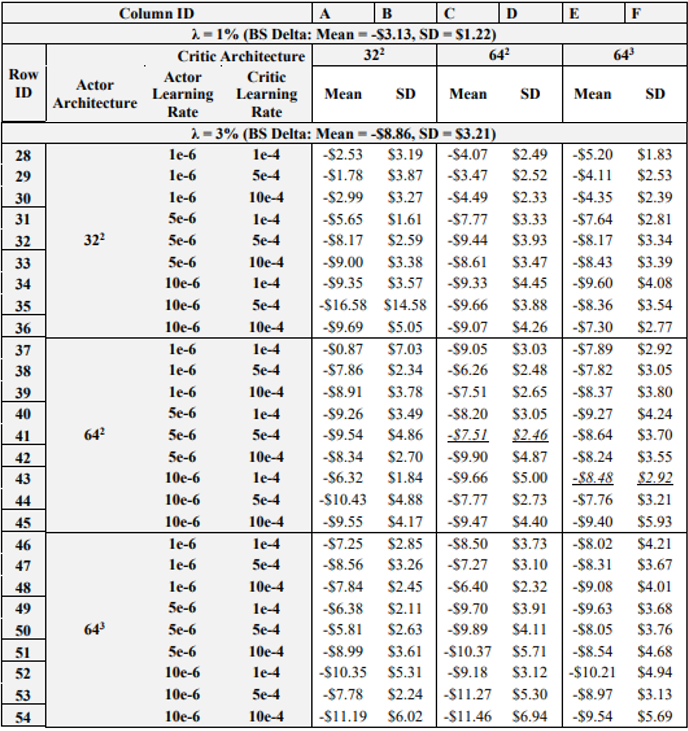
\ Table 4 details the results of the next experiment, wherein the learning rates and NN architectures for both the actor and critic networks are varied. Note again that italicized and underlined results are for agents that outperform the BS Delta in both mean and standard deviation, under both 1 and 3% transaction costs. Further, the reader should be aware that row and column IDs are added to Table 4 due to the amount of data presented, to aid in the explanation of results.
\ 
\ 
\ 
\ As for positive results, recall that in the previous experiment, (5e-6, 5e-4, 5000) was the only combination that achieved better results than the BS Delta on both 1 and 3 % transaction costs. However, in the previous experiment the actor-critic learning rate combination of 10e-6 and 1e-4 also yielded satisfactory results when using 7500 episodes. Now, when varying the NN architectures, it is shown that when actor critic learning rates are 10e-6 and 1e-4, respectively, increasing the critic NN architecture to 643 yields a DRL agent that outperforms the BS Delta on both 1 and 3% transaction costs. As such, just as it was seen that lowering the critic learning rate and increasing the episodes yields positive performance, lowering the critic learning rate and increasing the depth of the NN improves hedging results. These results show that if the learning rates are optimized, i.e., lowered sufficiently, expanding the complexity of training, whether via increased episodes or a deeper NN will improve performance. However, if the learning rates are too high, increasing the model complexity will often yield worse results.
\ Table 5 displays the results of the next test, wherein DRL agents are tested using 10, 25, or 50 steps, and test in environments with 52 (weekly), 104 (bi-weekly), and 252 (daily) re-balancing steps. Final P&L statistics for the BS Delta benchmark are also listed for each number of re-balancing steps.
\ 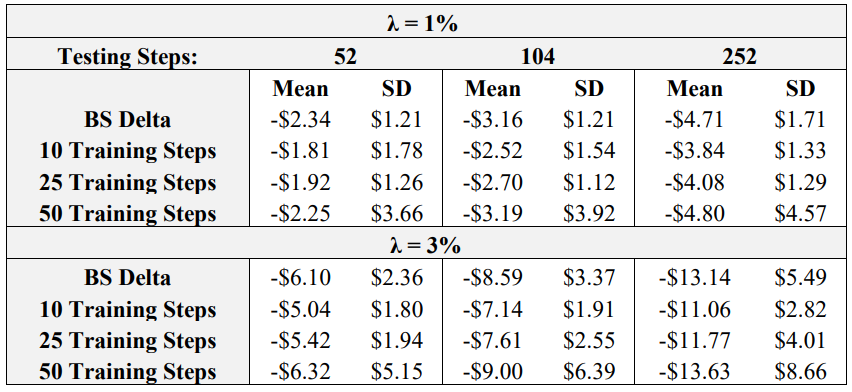
\ Immediately evident from the results is that for the actor learning rate – critic learning rate – episode combination held fixed for this experiment, (5e-6, 5e-4, 5000), 50 training steps yields an unstable training process, as the training data is increased without lowering the learning rate. In all cases, the mean and standard deviation for the agent trained using 50 steps is the worst among the three DRL agents. As for the other two agents, trained with 10 and 25 steps, respectively, it seems as if their results are quite similar. In all cases, the agent trained with 10 steps has a higher mean final P&L, but the agent trained with 25 steps always has a lower standard deviation. This indicates that more than 10 training steps are required to achieve a robust agent with consistent hedging performance with low variability. As for the effect of testing re-balance periods, there seems to be no general performance relationship between training and testing steps. For example, the agent trained with 10 steps is still able to perform quite well when there are 252 re-balance periods in testing. This is an encouraging result, as practitioners looking to implement agents to hedge frequently do not need to significantly increase the training steps, which would yield longer training times. Another note is that as re-balancing frequency increases, the discrepancy between DRL and Delta performance is more pronounced. This is because of transaction costs: more re-balancing yields more transaction cost accumulation, and it has been shown repetitively throughout the literature that DRL agents outperform the BS Delta as transaction cost effects become more pronounced.
\ 
\ 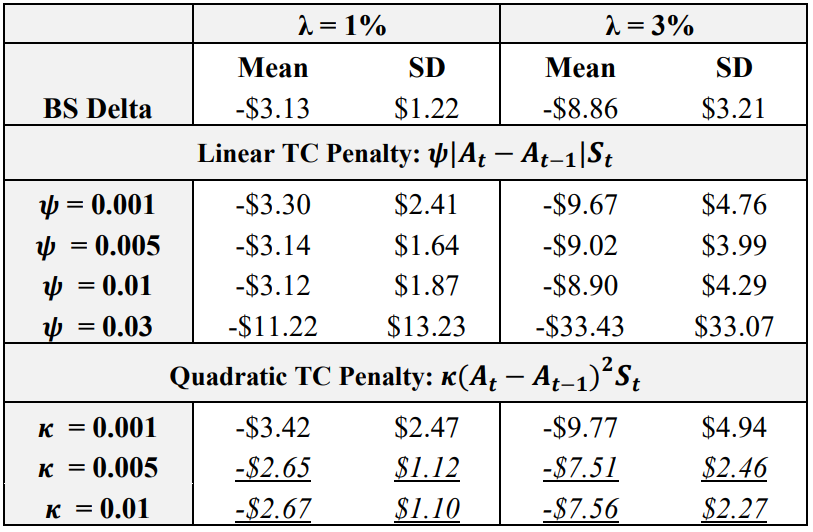
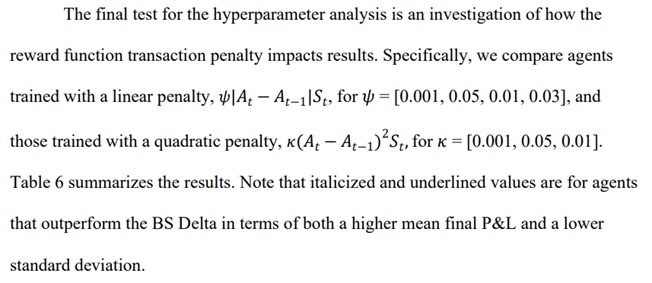
\ The results confirm the hypothesis from Pickard et al. (2024) in that DRL agents trained with a quadratic transaction cost penalty achieve superior performance in all cases. To reiterate, a quadratic penalty was implemented to punish large changes in the hedging position more heavily. This was done due to the threat of early exercise, and the quadratic penalty still enables the agent to make small action changes required to effectively hedge American options. As for a comparison of the quadratic penalty multipliers, it is found that 𝜅 = 0.005 and 𝜅 = 0.01 are optimal, outperforming the BS Delta for both 1 and 3% transaction costs. Agents trained with 𝜅 = 0.005 achieved a higher mean final P&L than those trained with 𝜅 = 0.01, while those trained with 𝜅 = 0.01 achieve a lower standard deviation. It is also worth noting that the training of the agent with a linear multiplier of 0.03 completely diverged, further exploiting the deficiencies of the linear penalty function.
\
5.2 Market Calibrated DRL with Weekly Re-Training
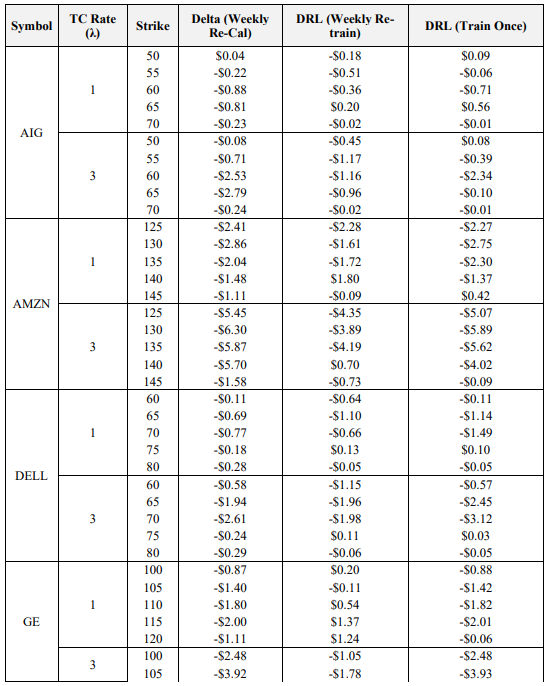
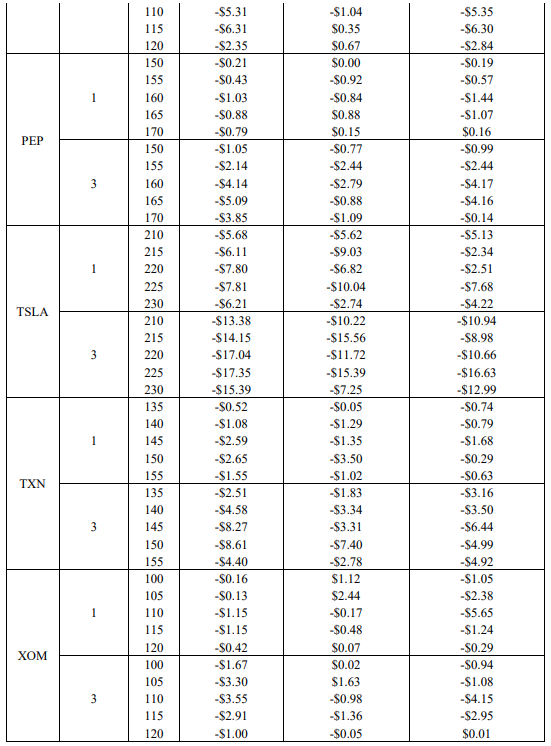
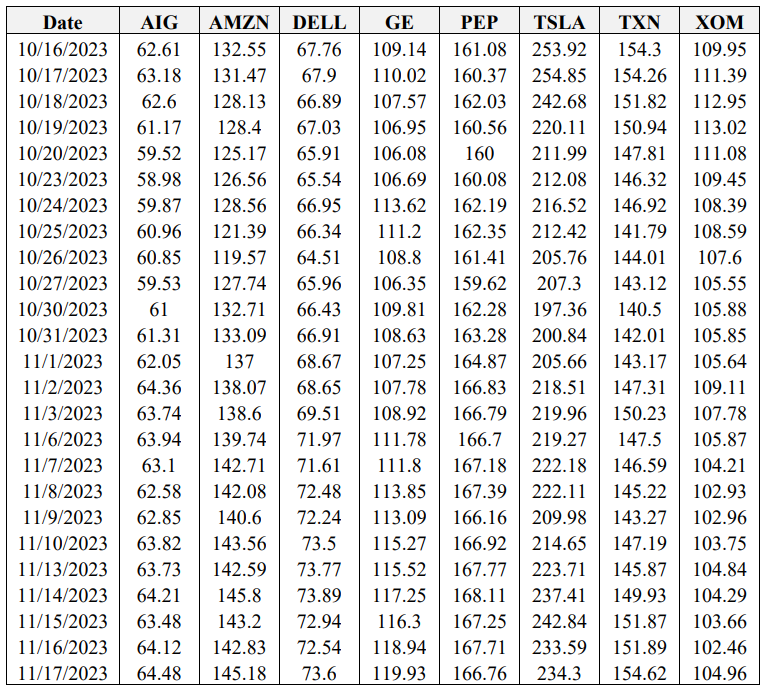
The final objective of this study is to optimize the key result of Pickard et al. (2024), wherein market calibrated DRL agents outperform the BS Delta method, by examining the impact of re-training DRL agents with re-calibrated stochastic volatility models each week. Recall that options on 8 symbols, with 5 strikes each are used. Hedging results using the empirical asset path for each respective symbol between the sale date (October 16th, 2023) and maturity date (November 17th, 2023) are presented in Table 7. Italicized and underlined are the optimal agent for each case. Note that the average final P&L is averaged across the five strikes for ease of presentation here, but the results for all 40 options are provided in the Appendix. The asset paths for all 8 symbols between October 16th, 2023, and November 17th, 2023, are also available in the Appendix.
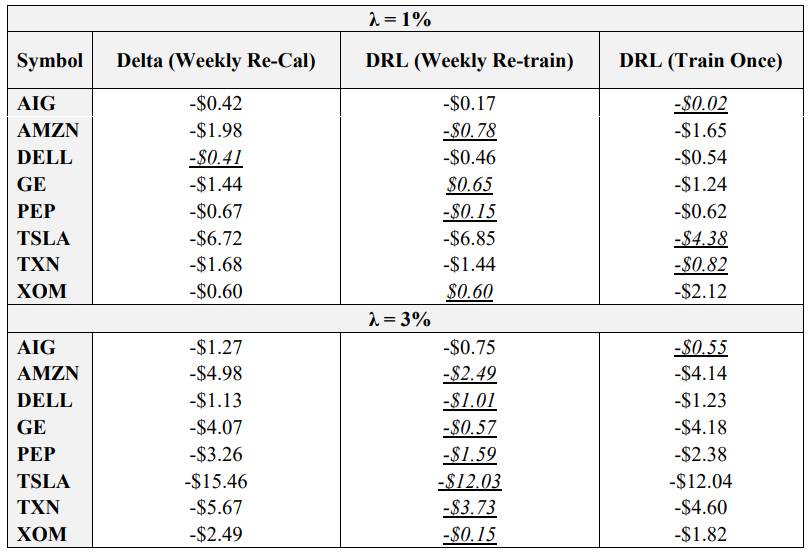
\ The results confirm the hypothesis that DRL agents re-trained each week with re-calibrated models outperform DRL agents only trained on the sale date. Specifically, weekly retrained agents outperform single trained agents in 12 of the 16 cases listed above. Moreover, the DRL agent with weekly re-training outperforms the BS Delta method, which uses the updated volatility from the re-calibrated model, in 14 of 16 cases. This is a very encouraging result, as not only does it reiterate the finding of Pickard et al. (2024) that DRL agents may be implemented for hedging real asset paths by training them with market calibrated models, but by re-calibrating the models with higher frequency, DRL performance improves. The use case here for practitioners is evident: given a basket of options and the underlying option data, i.e., the bid-ask spread and the implied volatility surface, DRL agents may be trained each week with the aid of new, recalibrated Chebyshev models to effectively hedge each option in the basket. Moreover, recall that another key of this proposed method is that re-calibrating does not impose longer training times, as each DRL agent is only trained to hedge between successive recalibration points. As such, this work is trivially extended to more frequent recalibration.
\
6 Conclusions
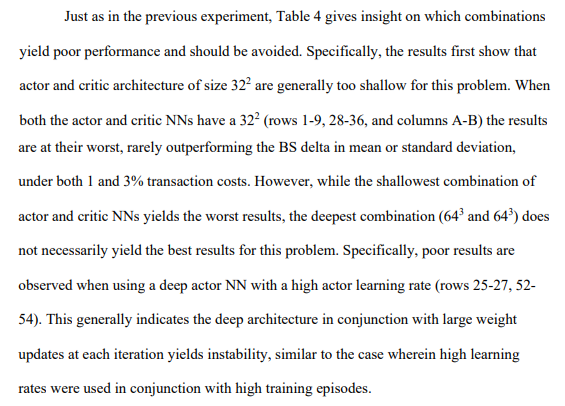
In conclusion, this paper extends the literature pertaining to the hedging of American options with DRL. First, a hyperparameter sensitivity analysis is performed to shed light on hyperparameter impact and provide a guide for practitioners aiming to implement DRL hedging. Results indicate not only the optimal hyperparameter sets for analyses across learning rates and episodes, learning rates and NN architectures, training steps, and transaction cost penalty functions, but provide key insight on what combinations should be avoided. For example, high learning rates should not be used in conjunction with high amounts of training episodes, and low learning rates should not be used when there is few training episodes. Instead, best results stem from middling values, and results also show that if the learning rates are low enough, increasing the number of training episodes will improve results. Further the analysis shows that two hidden layers with 32 nodes is too shallow for the actor and critic networks, and similar to the first experiment it is shown that when the learning rates are lowered, expanding the depth of the NN improves performance. Further, a third experiment shows that caution should be given to using too many training steps to avoid instability. A final hyperparameter test indicates that a quadratic transaction cost penalty function yields better results than a linear version.
\ This paper then built upon the key results of Pickard et al. (2024), by training DRL agents with asset paths from a market calibrated stochastic volatility model, noting that new DRL agents are trained each week to re-calibrated models. Results show that DRL agents trained each week outperform those trained solely on the sale date. Moreover, results show that DRL agents, both the single-train and weekly-train variants, outperform the BS Delta method at 1 and 3% transaction costs. As such, this paper has significant practical relevance, as it is shown that practitioners may use readily available market data to train DRL agents to hedge any option on their portfolio.
\
Appendix
\ 
\ 
\
References
Andrychowicz, Marcin, Anton Raichuk, Piotr Stanczyk, Manu Orsini, Sertan Girgin, Raphaël Marinier, Léonard Hussenot, et al. 2020. “What Matters In On-Policy Reinforcement Learning? A Large-Scale Empirical Study.” CoRR abs/2006.05990. https://arxiv.org/abs/2006.05990.
\ Ashraf, Nesma M., Reham R. Mostafa, Rasha H. Sakr, and M. Z. Rashad. 2021. “Optimizing Hyperparameters of Deep Reinforcement Learning for Autonomous Driving Based on Whale Optimization Algorithm.” PLOS ONE 16 (6): e0252754.
\ Assa, H., C. Kenyon, and H. Zhang. 2021. “Assessing Reinforcement Delta Hedging.” SSRN SSRN 3918375. http://dx.doi.org/10.2139/ssrn.3918375.
\ Black, Fischer, and Myron Scholes. 1973. “The Pricing of Options and Corporate Liabilities.” Journal of Political Economy 81 (3): 637–54. https://doi.org/10.1086/260062.
\ Bloch, Daniel Alexandre. 2023. “American Options: Models and Algorithms.” SSRN SSRN 4532952. http://dx.doi.org/10.2139/ssrn.4532952.
\ Brockman, Greg, V. Cheung, L. Pettersson, J. Schneider, J. Schulman, J. Tang, and W. Zaremba. 2016. “OpenAI Gym.” arXiv. https://doi.org/10.48550/arXiv.1606.01540.
\ Cao, Jay, Jacky Chen, Soroush Farghadani, John Hull, Zissis Poulos, Zeyu Wang, and Jun Yuan. 2023. “Gamma and Vega Hedging Using Deep Distributional Reinforcement Learning.” Frontiers in Artificial Intelligence 6. https://www.frontiersin.org/articles/10.3389/frai.2023.1129370.
\ Cao, Jay, Jacky Chen, John Hull, and Zissis Poulos. 2021. “Deep Hedging of Derivatives Using Reinforcement Learning.” The Journal of Financial Data Science 3 (1): 10–27. https://doi.org/10.3905/jfds.2020.1.052.
\ Du, Jiayi, Muyang Jin, Petter N. Kolm, Gordon Ritter, Yixuan Wang, and Bofei Zhang. 2020. “Deep Reinforcement Learning for Option Replication and Hedging.” The Journal of Financial Data Science 2 (4): 44–57. https://doi.org/10.3905/jfds.2020.1.045.
\ Eimer, Theresa, Caroline Benjamins, and Marius Thomas Lindauer. 2022. “Hyperparameters in Contextual RL Are Highly Situational.” arXiv. https://doi.org/10.48550/arXiv.2212.10876.
\ Ery, John, and Loris Michel. 2021. “Solving Optimal Stopping Problems with Deep QLearning.”
\ Fathan, Abderrahim, and Erick Delage. 2021. “Deep Reinforcement Learning for Optimal Stopping with Application in Financial Engineering.” CoRR abs/2105.08877. https://arxiv.org/abs/2105.08877.
\ Fathi, A., and B. Hientzsch. 2023. “A Comparison of Reinforcement Learning and Deep Trajectory Based Stochastic Control Agents for Stepwise Mean-Variance Hedging.” arXiv arXiv:2302.07996.
\ Giurca, B., and S. Borovkova. 2021. “Delta Hedging of Derivatives Using Deep Reinforcement Learning.” SSRN SSRN 3847272. https://ssrn.com/abstract=3847272.
\ Glau, Kathrin, Micro Mahlstedt, and Christian Potz. 2018. “A New Approach for American Option Pricing: The Dynamic Chebyshev Method.” arXiv. https://doi.org/10.48550/arXiv.1806.05579.
\ Hagan, Patrick, Deep Kumar, Andrew Lesniewski, and Diana Woodward. 2002. “Managing Smile Risk.” Wilmott Magazine 1 (January): 84–108.
\ Heston, Steven L. 1993. “A Closed-Form Solution for Options with Stochastic Volatility with Applications to Bond and Currency Options.” The Review of Financial Studies 6 (2): 327–43.
\ Hull, John, 1946-. 2012. Options, Futures, and Other Derivatives. Eighth edition. Boston : Prentice Hall, [2012] ©2012. https://search.library.wisc.edu/catalog/9910112878402121.
\ Islam, Riashat, Peter Henderson, Maziar Gomrokchi, and Doina Precup. 2017. “Reproducibility of Benchmarked Deep Reinforcement Learning Tasks for Continuous Control.” CoRR abs/1708.04133. http://arxiv.org/abs/1708.04133.
\ Kiran, Mariam, and Melis Ozyildirim. 2022. “Hyperparameter Tuning for Deep Reinforcement Learning Applications.” arXiv. https://doi.org/10.48550/arXiv.2201.11182.
\ Lillicrap, Timothy, Johnathan J. Hunt, Alexander Pritzel, Nicolas Heess, Tom Erez, Yuval Tassa, David Silver, and Daan Wierstra. 2015. “Continuous Control with Deep Reinforcement Learning.” arXiv arXiv:1509.02971. https://doi.org/10.48550/arXiv.1509.02971.
\ Longstaff, Francis A., and Eduardo S. Schwartz. 2001. “Valuing American Options by Simulation: A Simple Least-Squares Approach.” UCLA: Finance. https://escholarship.org/uc/item/43n1k4jb.
\ Mikkilä, Oskari, and Juho Kanniainen. 2023. “Empirical Deep Hedging.” Quantitative Finance 23 (1): 111–22. https://doi.org/10.1080/14697688.2022.2136037.
\ Mnih, V., K. Kavukcuoglu, David Silver, A. Graves, I. Antonoglou, Daan Wierstra, and M. Riedmiller. 2013. “Playing Atari with Deep Reinforcement Learning.” arXiv arXiv:1312.5602. https://doi.org/10.48550/arXiv.1312.5602.
\ Pham, Uyen, Quoc Luu, and Hien Tran. 2021. “Multi-Agent Reinforcement Learning Approach for Hedging Portfolio Problem.” Soft Computing 25 (12): 7877–85. https://doi.org/10.1007/s00500-021-05801-6.
\ Pickard, Reilly, and Yuri Lawryshyn. 2023. “Deep Reinforcement Learning for Dynamic Stock Option Hedging: A Review.” Mathematics 11 (24). https://doi.org/10.3390/math11244943.
\ Pickard, Reilly, Finn Wredenhagen, Julio DeJesus, Mario Schlener, and Yuri Lawryshyn. 2024. “Hedging American Put Options with Deep Reinforcement Learning”. arXiv:2405.06774
\ Silver, David, Guy Lever, Nicolas Heess, Thomas Degris, Daan Wierstra, and Martin Riedmiller. 2014. “Deterministic Policy Gradient Algorithms.” In Proceedings of the 31st International Conference on Machine Learning, edited by Eric P. Xing and Tony Jebara, 32:387–95. PMLR. https://proceedings.mlr.press/v32/silver14.html.
\ Sutton, Richard S., and Andrew G. Barto. 2018. Reinforcement Learning: An Introduction. A Bradford Book.
\ Watkins, Christopher John Cornish Hellaby. 1989. “Learning from Delayed Rewards.” King’s College. https://www.cs.rhul.ac.uk/~chrisw/new_thesis.pdf.
\ Xiao, B., W. Yao, and X. Zhou. 2021. “Optimal Option Hedging with Policy Gradient.” In 2021 International Conference on Data Mining Workshops (ICDMW), 1112– 19. IEEE. https://doi.org/10.1109/ICDMW53433.2021.00145.
\ Xu, Wei, and Bing Dai. 2022. “Delta-Gamma–Like Hedging with Transaction Cost under Reinforcement Learning Technique.” The Journal of Derivatives 29 (5): 60–82. https://doi.org/10.3905/jod.2022.1.156.
\ Zheng, C., J. He, and C. Yang. 2023. “Option Dynamic Hedging Using Reinforcement Learning.” arXiv arXiv:2306.10743.
\
:::info Authors:
(1) Reilly Pickard, Department of Mechanical and Industrial Engineering, University of Toronto, Toronto, Canada ([email protected]);
(2) F. Wredenhagen, Ernst & Young LLP, Toronto, ON, M5H 0B3, Canada;
(3) Y. Lawryshyn, Department of Chemical Engineering, University of Toronto, Toronto, Canada.
:::
:::info This paper is available on arxiv under CC BY-NC-ND 4.0 Deed (Attribution-Noncommercial-Noderivs 4.0 International) license.
:::
\


You May Also Like

Bitcoin etfs snap four-month slump as March inflows reach $1.32B

Liventus Acquires Tamarack to Become the Most Comprehensive Technology Partner for Equipment Finance Organizations


