Crude oil price closed strongly on Wednesday and continued higher in the latest session. The move pushed the market more than 5% above recent levels and kept attentionCrude oil price closed strongly on Wednesday and continued higher in the latest session. The move pushed the market more than 5% above recent levels and kept attention

Analyst Warns Against Being Bullish on Crude Oil, Points to Potential Dangers Ahead

2026/02/19 19:30
3 min read

Crude oil price closed strongly on Wednesday and continued higher in the latest session. The move pushed the market more than 5% above recent levels and kept attention fixed on the path toward the $70 region at the time of writing.

Strength like this often creates confidence, yet the broader structure around oil, currency pressure, and yields introduces a more cautious tone beneath the surface.

Market commentator ViPiN, known on X as @AlgoBoffin, presents that cautious view. His recent note explains that visible strength in crude oil does not remove hidden risks tied to geopolitics, liquidity, and valuation pressure.

The message focuses on how quickly sentiment can reverse once energy, currency movement, and leverage begin to interact.

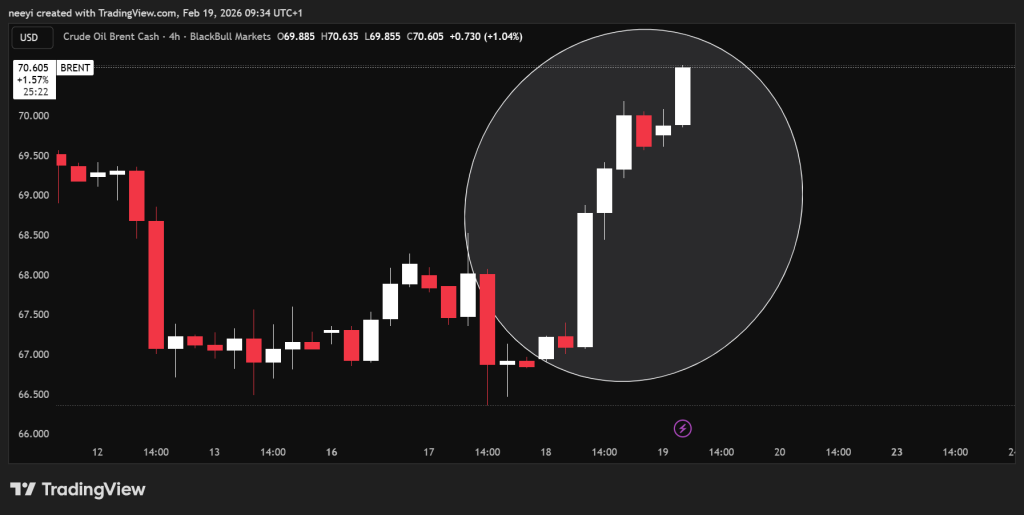
BRENT CRUE OIL CHART

Crude Oil Price Strength Meets Geopolitical And Currency Risk

ViPiN highlights the ongoing Iran and Hormuz tension as a factor that keeps risk premium alive inside the crude oil price. Energy markets can react sharply to a single headline when supply routes face uncertainty.

Dollar strength and rising yields can amplify that reaction because tighter financial conditions often pressure valuations across global markets.

This combination creates a fragile balance. Oil may rise in the short term, yet the same forces that support price can later pressure equities, currencies, and leveraged positions.

ViPiN frames this chain reaction as a trap that forms when optimism grows too quickly around energy strength.

ViPiN also draws attention to volatility conditions and derivatives exposure within the Indian market. Low volatility levels often signal comfort among participants.

High leverage inside futures and options can turn that comfort into risk once price direction changes. Weak market breadth adds another layer of concern because index stability may hide underlying softness.

Liquidity tends to disappear before prices adjust. That sequence matters for crude oil because energy-driven yield pressure can tighten financial conditions across multiple asset classes at the same time. ViPiN views this structure as vulnerable if crude oil volatility expands suddenly.

Critical February Window Could Decide Crude Oil Direction

Timing forms a key part of ViPiN’s warning. He points to a narrow February window where bull traps may appear before crude oil chooses a clearer direction. Energy movement during this period could influence currency stability, valuation pressure, and forced selling across leveraged positions.

Read Also: Silver Price Crash? Open Interest Says This Could Be a Bear Trap Instead

Such alignment does not guarantee a downturn, yet it explains why caution remains important even during visible price strength. Oil markets often change direction when confidence reaches comfortable extremes. ViPiN’s conclusion centers on preparedness instead of prediction.

Crude oil remains one of the most influential forces across global finance. Strength can support growth expectations, yet sudden reversal can tighten liquidity and pressure valuations.

Subscribe to our YouTube channel for daily crypto updates, market insights, and expert analysis.

The post Analyst Warns Against Being Bullish on Crude Oil, Points to Potential Dangers Ahead appeared first on CaptainAltcoin.

Market Opportunity
Bullish Degen Logo
Bullish Degen Price(BULLISH)
$0.008274
$0.008274$0.008274
+4.97%
USD
Bullish Degen (BULLISH) Live Price Chart
Disclaimer: The articles reposted on this site are sourced from public platforms and are provided for informational purposes only. They do not necessarily reflect the views of MEXC. All rights remain with the original authors. If you believe any content infringes on third-party rights, please contact [email protected] for removal. MEXC makes no guarantees regarding the accuracy, completeness, or timeliness of the content and is not responsible for any actions taken based on the information provided. The content does not constitute financial, legal, or other professional advice, nor should it be considered a recommendation or endorsement by MEXC.

You May Also Like

Wormhole’s W token enters ‘value accrual’ phase with strategic reserve

Wormhole’s W token enters ‘value accrual’ phase with strategic reserve

Wormhole has moved beyond its distribution phase, initiating a new strategy. By allocating on-chain and off-chain protocol revenue to a dedicated treasury, the cross-chain protocol is creating a direct link between its commercial success and the value of its native…
Share
Crypto.news2025/09/18 03:05
Wall Street sets AMD stock price target for next 12 months

Wall Street sets AMD stock price target for next 12 months

The post Wall Street sets AMD stock price target for next 12 months appeared on BitcoinEthereumNews.com. Advanced Micro Devices (NASDAQ: AMD) has been hit hard
Share
BitcoinEthereumNews2026/02/19 19:51
SUI Price Eyes Breakout, Targets $11 Says Analyst

SUI Price Eyes Breakout, Targets $11 Says Analyst

The post SUI Price Eyes Breakout, Targets $11 Says Analyst appeared on BitcoinEthereumNews.com. SUI price shows a technical setup for a macro breakout with analyst Dan Gambardello targeting $10-$11 levels. Recent partnership with Google’s Agentic Payments Protocol adds fundamental support to the technical analysis as SUI moves closer to potential breakout levels. SUI Price Analysis Points to $10-$11 Breakout Target Dan Gambardello has identified a clear ascending triangle formation on SUI price daily chart with upside targets around $10.79. The analyst simplified this target range to $10-$11 for practical trading purposes. The pattern shows sustained higher lows meeting resistance at current levels before a potential breakout. VanEck maintains more aggressive SUI crypto targets ranging from $13-$25 according to Gambardello’s research. SUI Price Analysis | Source: Dan Gambardello, X The $10 level is a more conservative higher high area for the current cycle. Midterm targets point to $7.50 in the 1.618 Fibonacci extension zone before longer-term objectives. The monthly RSI shows extreme compression that Gambardello describes as “screaming for a macro breakout to the upside.” This momentum oscillator behavior typically precedes major price movements in the crypto market. SUI crypto risk model currently sits at 51 and matches pre-bull market levels seen in coins like Ethereum. Gambardello compared this to Ethereum’s December 2020 reading of 51 before its major breakout. The March 2017 Ethereum reading of 53 preceded that cycle’s parabolic move. The analyst also noted that SUI price trades near the same levels from almost a year ago in November 2024. Bollinger Bands Signal Historic Compression CryptoBullet has identified the tightest Bollinger Bands in SUI’s entire trading history on the weekly chart. The BBW indicator compression reached levels that were historically followed by major price movements. This setup mirrors conditions before SUI’s previous major rallies. Historical data shows SUI price delivered +253% gains between December 2023 and March 2024 following similar compression. SUI…
Share
BitcoinEthereumNews2025/09/18 11:32