

Solana Price: Bleeding Into Support, Or Just Getting Started? (SOLUSDT Analysis)

Market conditions remain fragile as Solana price trades in a decisive downtrend, with volatility elevated and sentiment deeply negative across crypto.
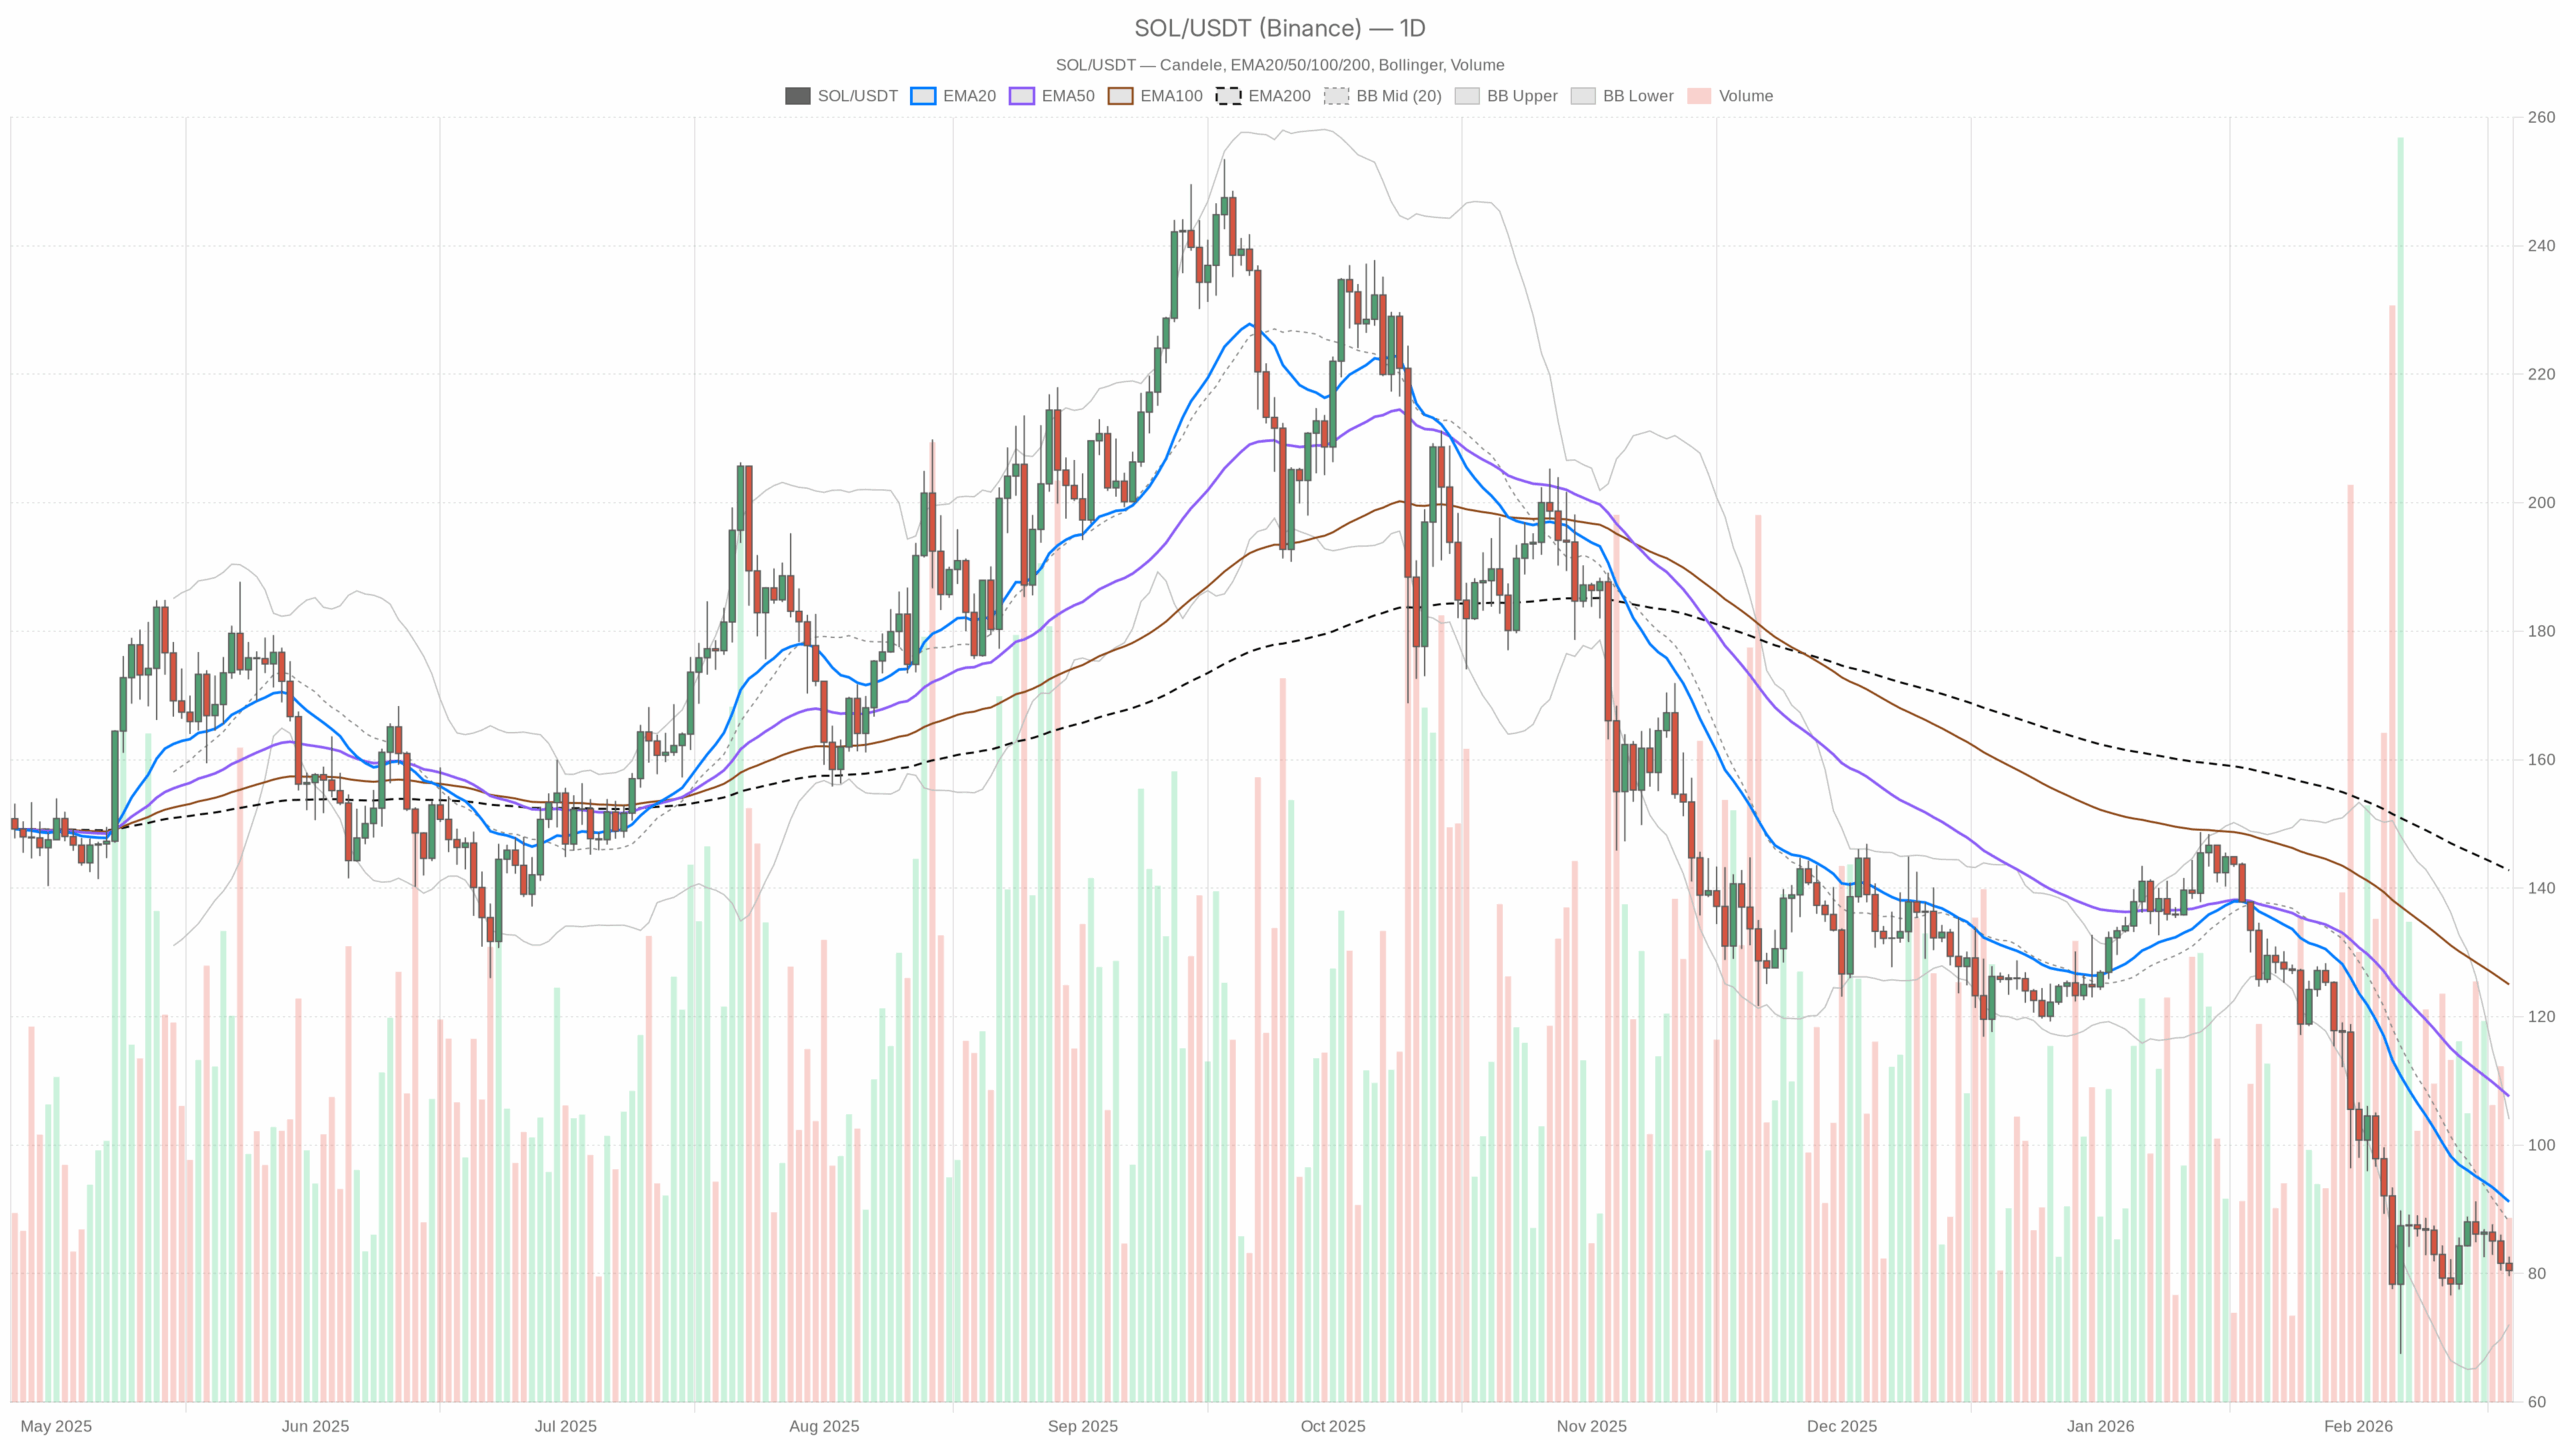 SOL/USDT — daily chart with candlesticks, EMA20/EMA50 and volume.
Daily Chart (D1): Macro Bias – Clearly Bearish, But Getting Stretched
Trend Structure: EMAs
- Price (close): $80.48
- EMA 20: $91.19
- EMA 50: $107.60
- EMA 200: $142.78
- Regime: bearish
Solana is trading well below the 20, 50 and 200-day EMAs, with a clean bearish stack (price < EMA 20 < EMA 50 < EMA 200). The 20-day sits ~13% above current price, which signals the short-term down-move is already extended but still very much intact. Moreover, trend-followers are in control; any bounce towards $90–$100 is technically a rally into overhead supply, not a confirmed trend change.
Momentum: RSI (Daily)
- RSI 14 (D1): 32.20
Daily RSI is hovering just above classical oversold territory. Bears still have the upper hand, but downside momentum is starting to look tired. This is the zone where trend traders can keep short exposure, yet early dip-buyers will start sniffing around for potential mean reversion. It is weak, not yet capitulative.
Momentum: MACD (Daily)
- MACD line: -9.37
- Signal line: -10.41
- Histogram: +1.04
The MACD lines are deep in negative territory, confirming a sustained bearish phase. However, the MACD line has crossed above the signal line, giving a positive histogram. That is an early sign that downside momentum is easing; think of it as the brakes being tapped on the selloff, not yet a full U-turn. In a strong downtrend, this kind of MACD improvement often fuels countertrend rallies that fail into resistance.
Volatility & Positioning: Bollinger Bands (Daily)
- BB mid (20-period basis): $88.05
- BB upper: $104.02
- BB lower: $72.08
Solana price is trading below the Bollinger mid-band and in the lower half of the band structure, closer to the lower band at $72. Price has already made a run toward the lower band, which is consistent with an ongoing downtrend. The fact that it is not pinned hard to the band suggests sellers are in control but not in full capitulation mode. There is room for a tag of the lower band near $72 if sentiment weakens further, but equally, a snap-back towards the mid-band around $88 is plausible if shorts get crowded.
Volatility Gauge: ATR (Daily)
- ATR 14 (D1): $6.51
With ATR around $6.5, the typical daily range is roughly 8% of current price. That is elevated but not extreme for Solana. Practically, it means both downside flushes and upside squeezes can be violent within a single day. Therefore, position sizing and stops need more buffer than during calmer phases.
Short-Term Daily Levels: Pivots (D1)
- Pivot Point (PP): $80.92
- R1: $82.23
- S1: $79.17
Price is slightly below the daily pivot at $80.92, hovering between PP and S1. That is an intraday-bearish skew on the higher timeframe: the market is trading under its short-term equilibrium, with $82–83 acting as the first band of resistance and $79 the immediate support to watch for a potential flush toward the lower Bollinger band near $72.
Daily takeaway: The main scenario is bearish. The market is in a mature downtrend with early signs of selling fatigue. Until Solana can reclaim and hold above the daily 20 EMA (~$91), any bounce is structurally a rally within a downtrend.
1-Hour Chart (H1): Tactical Bias – Bearish, But Sliding Into Support
Trend: EMAs (H1)
- Price (close): $80.61
- EMA 20: $81.59
- EMA 50: $82.77
- EMA 200: $84.29
- Regime: bearish
On the hourly, Solana is also trading below all key EMAs, which are smoothly fanned out above price. That is consistent with a controlled intraday downtrend rather than a panic dump. Any move back into $82–84 on the hourly chart will hit a wall of moving-average resistance where short-term sellers are likely waiting.
Momentum: RSI (H1)
- RSI 14 (H1): 37.74
Hourly RSI sits in bearish-but-not-oversold territory. There is still room for another leg lower without requiring an immediate bounce. Bulls do not have momentum yet; the best they can argue is that the downside is no longer accelerating.
Momentum: MACD (H1)
- MACD line: -0.65
- Signal line: -0.61
- Histogram: -0.04
The hourly MACD is marginally negative, with the line just under the signal line. Momentum is weakly bearish and drifting rather than sharply trending. That often aligns with a grind lower or sideways chop, not with a strong reversal attempt. Bulls would want to see this cross back above the signal with an expanding positive histogram before talking about a serious intraday shift.
Bollinger Bands & Volatility (H1)
- BB mid: $81.43
- BB upper: $82.54
- BB lower: $80.33
- ATR 14 (H1): $0.75
Price is near the lower hourly Bollinger band at $80.33, with ATR around $0.75. That puts Solana near short-term support after a recent push down. Intraday, this is where you often see either a brief bounce or a band walk. Given the broader bearish context, a slow crawl along the lower band is more likely than a clean V-shaped recovery unless macro conditions suddenly improve.
Hourly Pivots
- Pivot Point (PP): $80.44
- R1: $80.94
- S1: $80.12
Price is sitting basically on the hourly pivot ($80.44–80.61 area), meaning the market is at a local decision point. A sustained push above R1 (~$80.94) would open the door for a test of the hourly EMAs near $81.5–82. Failing here and losing S1 (~$80.12) would validate continuation pressure toward $79 and the daily S1 zone.
15-Min Chart (M15): Execution Context – Seller Control, No Clear Base Yet
Trend: EMAs (M15)
- Price (close): $80.58
- EMA 20: $80.88
- EMA 50: $81.37
- EMA 200: $82.84
- Regime: bearish
The 15-minute chart mirrors the higher timeframes: price under all EMAs, with a clear bearish alignment. Short-term rallies into $81–82 are likely to meet sellers quickly. For intraday traders, that area is the obvious battleground for fade setups unless structure changes.
Momentum: RSI (M15)
- RSI 14 (M15): 40.67
On the 15-minute, RSI is weak but not oversold. That supports a slow grind or mild intraday bounces, not a clean trend reversal. Momentum across all three timeframes is consistently on the bearish side, just not at extremes.
Momentum: MACD (M15)
- MACD line: -0.40
- Signal line: -0.35
- Histogram: -0.06
The 15-minute MACD is mildly bearish with a small negative histogram. Sellers remain in control, but there is no strong thrust; it is controlled pressure rather than aggressive dumping. This usually favors shorting failed bounces rather than chasing breakdowns at local lows.
Bollinger Bands & ATR (M15)
- BB mid: $80.99
- BB upper: $82.17
- BB lower: $79.81
- ATR 14 (M15): $0.46
Solana is trading just below the mid-band on M15, not pressed into extremes. Intraday volatility around $0.46 per 15-minute bar is meaningful but not chaotic. This structure favors range-trading or trend-follow setups rather than betting on immediate violent reversals.
M15 Pivots
- Pivot Point (PP): $80.44
- R1: $80.91
- S1: $80.10
The 15-minute pivot roughly coincides with the hourly pivot, reinforcing the $80.4–80.6 zone as the short-term decision area. As long as M15 candles are closing below R1 (~$80.91) and the 20 EMA, the very short-term flow stays in favor of sellers.
Bullish Scenario for Solana Price (Countertrend Bounce)
A bullish case from here is countertrend only on current data. It hinges on selling pressure finally exhausting in this $78–81 band and the broader market stabilizing.
What bulls want to see:
- A clear intraday higher low above roughly $79, visible on the 1H and 15m charts, rather than a straight-line bleed.
- Hourly RSI pushing back above 45–50 with MACD crossing positive and expanding, showing fresh upside momentum rather than just a dead-cat bounce.
- Price reclaiming and holding above the H1 EMA 20 (~$81.6) first, then the H1 EMA 50 (~$82.8). That would signal bears are losing grip on the intraday trend.
- A push toward the daily Bollinger mid-band around $88, and ideally a test of the daily EMA 20 near $91. That is the logical first upside target zone for any relief rally.
If Solana can close multiple daily candles back above $91 (the 20-day EMA) with RSI lifting toward neutral (40s–50s) and MACD staying in a positive cross, the conversation shifts from a dead-cat bounce to a potential medium-term base forming.
Bullish scenario invalidation: A decisive break and daily close below the lower daily Bollinger band area, roughly $72, would seriously damage the bounce setup and point to a fresh leg lower. Also, continued failure to reclaim even the H1 EMA 20 while BTC dominance grinds higher would keep bulls firmly on the back foot.
Bearish Scenario for Solana Price (Trend Continuation)
The main scenario, given the data, is still trend continuation to the downside. The structure across D1, H1, and M15 is aligned: price below EMAs, bearish regimes on all timeframes, and a macro environment of extreme fear with BTC dominance rising.
What bears are looking for:
- Failure of price to hold above the intraday pivots at $80.4–80.6, followed by a clean loss of the $79–80 area (daily S1 and local support band).
- Hourly and 15-minute RSI staying weak (sub-45) on any bounce, showing no real momentum shift.
- Hourly and daily MACD remaining in negative territory even if the histogram flips around zero, meaning rallies without structural trend change.
- A move toward the daily lower Bollinger band region around $72. If fear deepens, price can overshoot that band before any lasting relief.
Below $72, there is a risk of a momentum break where forced liquidations and stop runs accelerate the downside. With daily ATR at $6.5, a one- or two-day slide of $10–15 is entirely possible if liquidity thins out.
Bearish scenario invalidation: Bears start losing the narrative if Solana can:
- Reclaim the H1 EMA 200 (~$84.3) and hold above it, turning it into support.
- Push into the $88–91 zone (daily mid-band and EMA 20) and consolidate there instead of instantly rejecting.
- Show a daily RSI drift back into the 40s–50s with MACD holding a sustained positive cross.
Under those conditions, shorting every bounce becomes dangerous; the market would be shifting from a pure trend phase into a potential range or early accumulation.
How to Think About Positioning Now
Solana is in a clear downtrend on the daily, hourly, and 15-minute charts, with all EMAs stacked bearishly and momentum weak across the board. At the same time, daily RSI near 32 and a MACD that is starting to curl up indicate the easy part of the short trade may be behind us. This is often the phase where trend followers still have the edge, but the risk of sharp, painful squeezes increases.
In practice:
- Any strength into the $82–88 band is currently a test of resistance, not a proven trend reversal.
- The first real structural shift would be a sustained reclaim of the daily EMA 20 around $91.
- The downside magnet in the current structure is the $72 daily lower Bollinger band region, with volatility high enough to reach it quickly if sentiment worsens.
Volatility is elevated, market-wide fear is extreme, and BTC is soaking up dominance. That combination can produce both deep flushes and violent bear-market rallies. Whatever your bias on Solana price, the data argues for respecting risk, as ranges are wide, reversals can be abrupt, and certainty is low even if the current trend is clearly down.


You May Also Like

Iran threatens retaliation as Trump vows to “hit hard,” crypto market under stress

Tulsi Gabbard’s rise to power potentially guided by ‘controlling cult’ leader: report

CoreWeave (CRWV) Stock Surges 12% on $8.5B GPU-Backed Financing Deal — Here’s the Full Picture


