

Bitcoin Price Prediction: BTC ETFs Record $133M in Outflows as Sentiment Stays in Extreme Fear
US spot Bitcoin ETFs recorded $133.3 million in net outflows on Wednesday as market sentiment remained deeply entrenched in “Extreme Fear”.
The withdrawals bring weekly losses to $238 million, setting the stage for a potential five-week consecutive outflow streak amid weakening institutional interest and testing technical support levels.
This shift in flows has intensified the Bitcoin price prediction debate, with analysts assessing whether the current weakness signals a deeper correction or a consolidation phase before a potential rebound.
EXPLORE: What is the Next Crypto to Explode in 2026?
Bitcoin ETF Outflows Signal Institutional Caution
The sustained selling pressure highlights a notable shift in institutional behavior following a strong start to the year. BlackRock’s iShares Bitcoin Trust (IBIT) led the exits with over $84 million withdrawn in a single session.
While recent data points to weakening institutional interest regarding US-listed products, the underlying metrics suggest this may be a readjustment rather than a full exit.
Total Net Assets in Bitcoin ETFs remain substantial at $83.6 billion, representing roughly 6.3% of the asset’s total market capitalization. Trading volumes, however, remained subdued at under $3 billion, indicating a lack of conviction from buyers to absorb the selling pressure immediately.
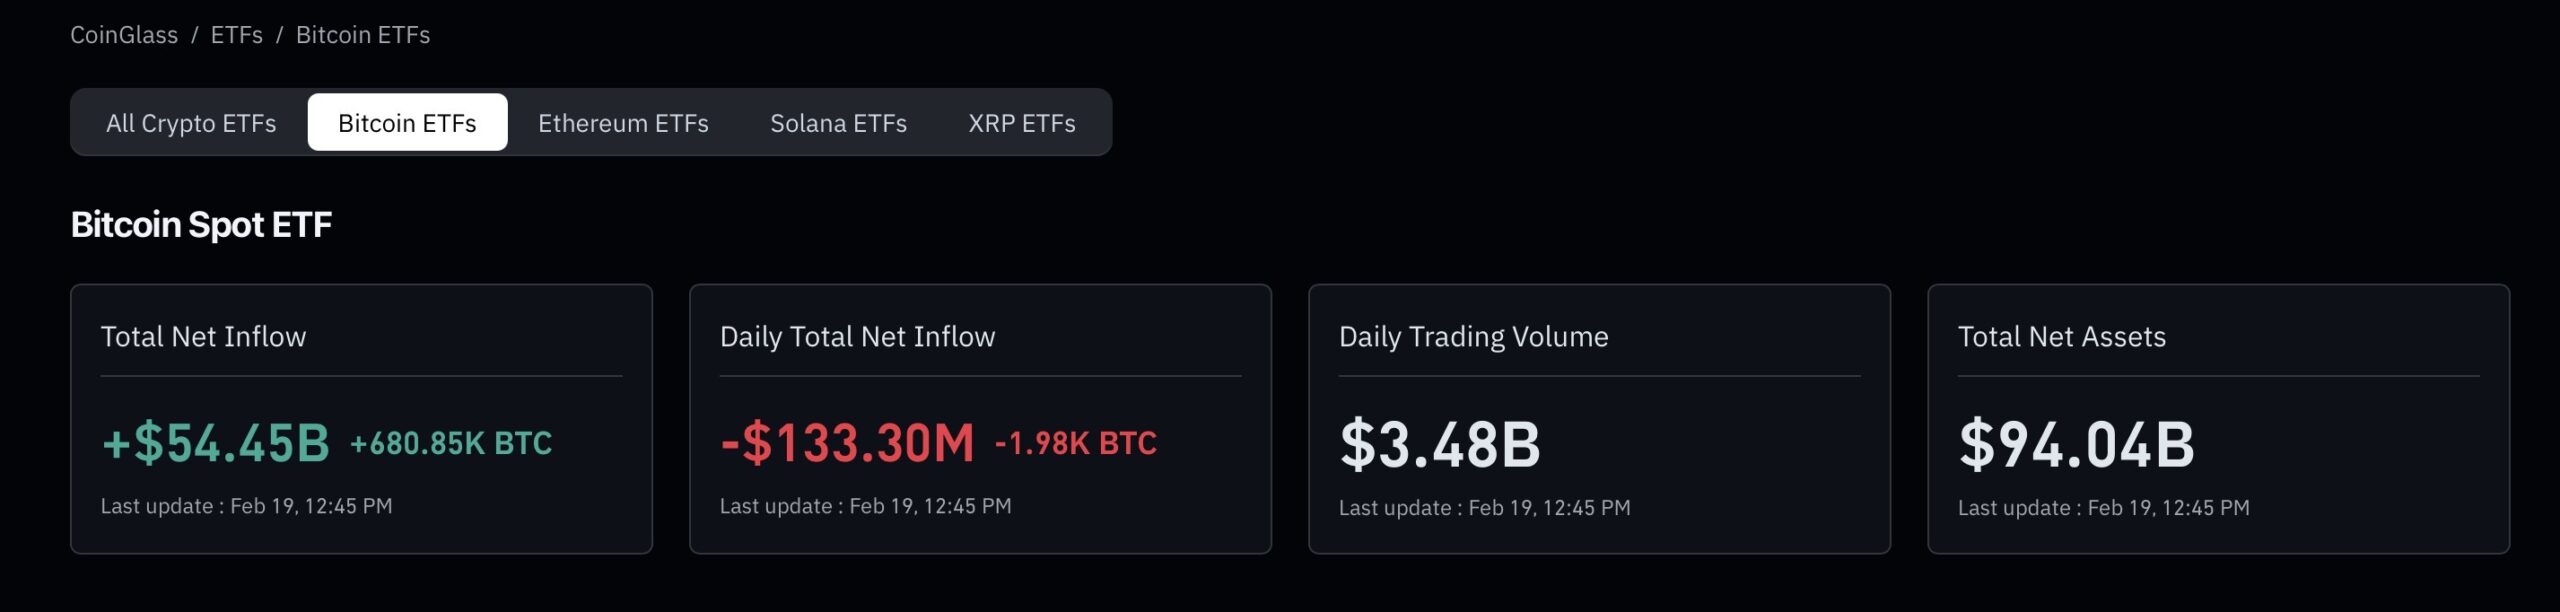
Bitcoin Total Net Assets Source: Coinglass
DISCOVER: Best Solana Meme Coins By Market Cap 2026
Sentiment Metrics Point to Sustained Bearish Conditions And a Cautious Bitcoin Price Prediction
Market sentiment has deteriorated significantly, with the Crypto Fear & Greed Index lingering in “Extreme Fear” territory.
This reading often implies excessive investor worry, but some analysts see these metrics as potential contrarian buy signals. This dynamic was explored when BitMine added ETH during similar sentiment dips. The current reading aligns with Bitcoin dipping below $66,000, testing investor resolve after multi-month lows.
Interestingly, despite the headline outflows, long-term Bitcoin ETF holders have shown “diamond hands” during broader market crashes, suggesting the current selling may be tactical rebalancing rather than panic-driven capitulation.
A distinct divergence is also emerging in the altcoin sector; US spot Solana ETFs bucked the negative trend, recording a six-day streak of inflows and reinforcing a narrative of capital rotation toward high-throughput alternatives.
Bitcoin Price Prediction: Can We Expect A Further Dip?
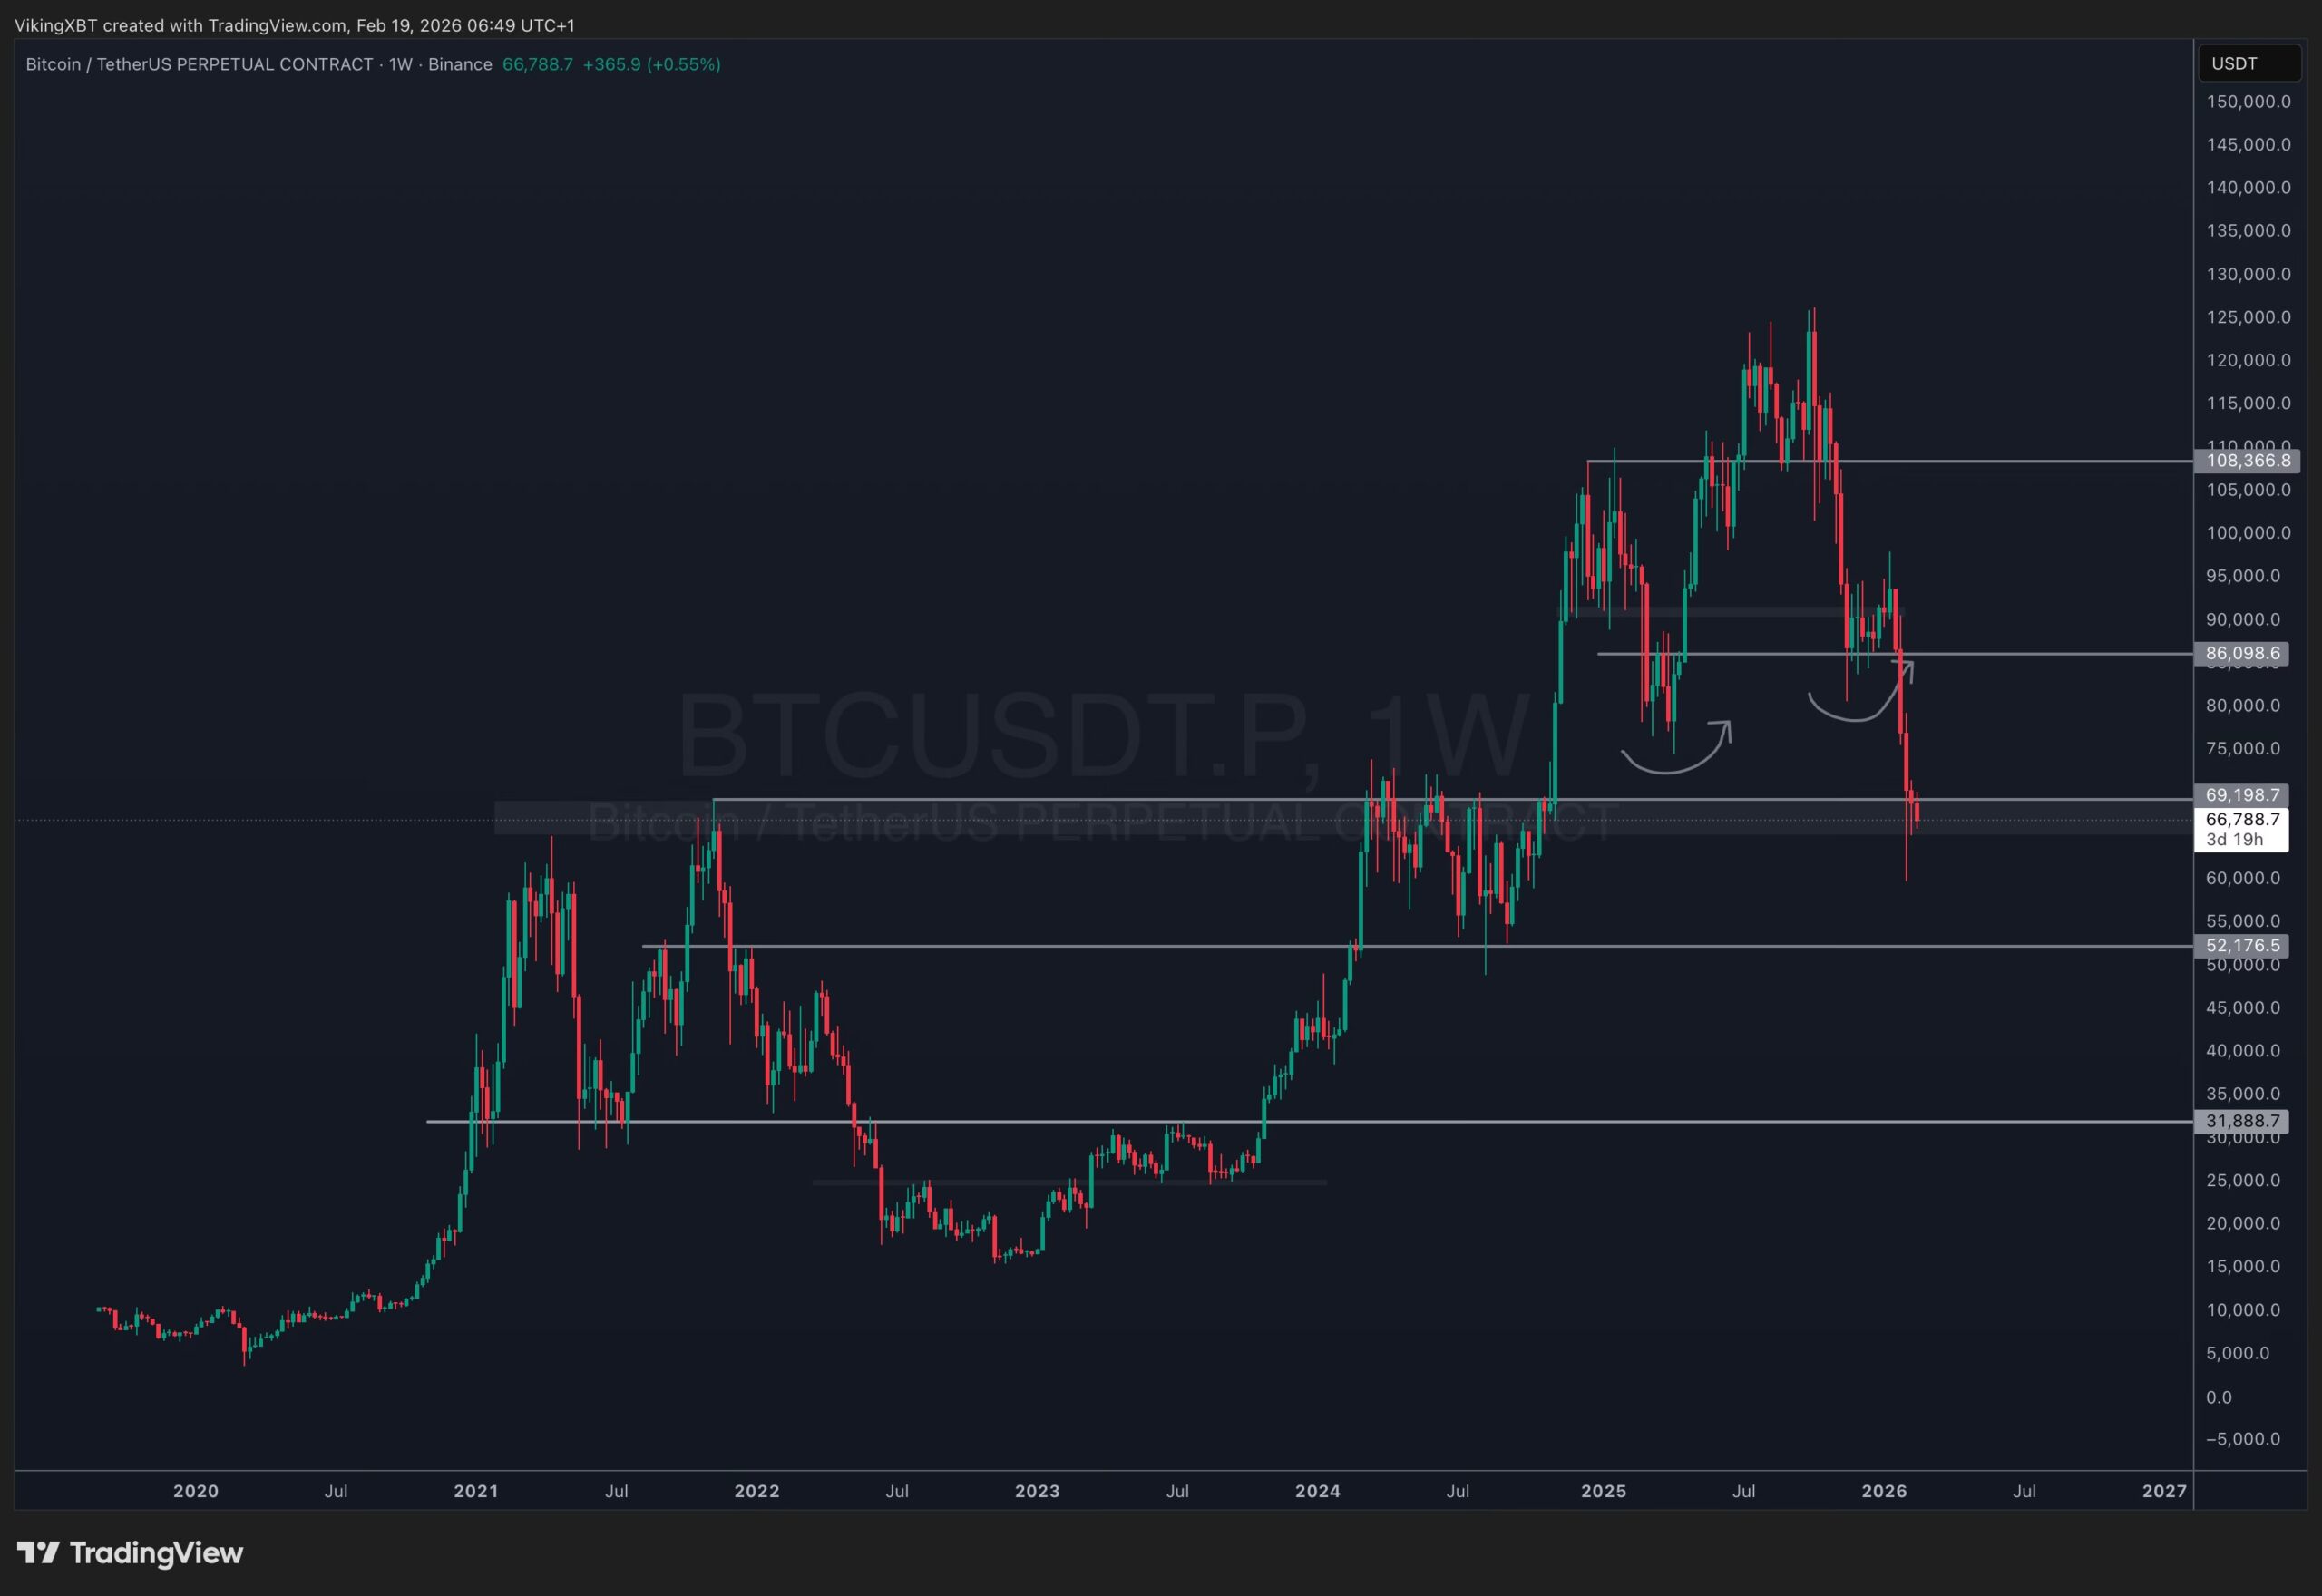
Bitcoin Price Prediction Source: TradingView
The immediate outlook for Bitcoin hinges on its ability to reclaim support levels after the recent dip below $66,000. If outflows persist through Friday, the market will confirm its first five-week outflow streak since March 2025.
Analysts suggest this behavior reflects macro-sensitive “beta” trading rather than fundamental failure. While rotation continues, the $60,000 floor remains a critical psychological barrier.
Traders are closely monitoring whether US outflows will stabilize or if European investment resilience can offset domestic selling pressure in the coming weeks.
DISCOVER: Best Solana Meme Coins By Market Cap 2026
Can Bitcoin Hyper Capture On-Chain Demand During BTC’s Weak Phase?
After outflows from US spot Bitcoin ETFs weighed on sentiment and kept the market in “Extreme Fear”, some investors are looking toward alternative ways to engage with the Bitcoin ecosystem during this phase of possible consolidation.
While total net assets in Bitcoin ETFs remain near $83–94 billion and dip-buyers from strategy desks are accumulating on price weakness, a distinct narrative has emerged around scaling infrastructure that could bring more on-chain activity back to Bitcoin.
Bitcoin Hyper (HYPER) is an ongoing presale for a Layer-2 network that aims to extend Bitcoin’s core strengths with faster, low-cost transactions and smart contract support by integrating Solana’s Virtual Machine (SVM) and a Canonical Bridge to Bitcoin.
The native HYPER token plays multiple roles: it’s used for network fees, governance, and staking: early participants can lock tokens during the presale to earn rewards leading into launch.
With a fixed supply of 21 billion tokens and staged pricing that increases as rounds progress, the presale gives early supporters a way to gain exposure before exchange listings and mainnet deployment, currently targeted for late 2025–Q1 2026.
Audits from firms like Coinsult and SpyWolf support its technical foundation.
In a market where rotations favor assets with enhanced utility, Bitcoin Hyper positions itself to extend Bitcoin’s role beyond a store of value.
Join Bitcoin Hyper community on Telegram and X.
Visit Bitcoin Hyper Here
DISCOVER: How to Buy Bitcoin Hyper – 2026 ICO Guide
nextThe post Bitcoin Price Prediction: BTC ETFs Record $133M in Outflows as Sentiment Stays in Extreme Fear appeared first on Coinspeaker.
You May Also Like
Pi Network (PI) Daily Market Analysis 22 February 2026

Markets await Fed’s first 2025 cut, experts bet “this bull market is not even close to over”
