

The Defected Story Points Model in Extreme Programming
Table of Links
Abstract and 1. Introduction
-
Background and 2.1. Related Work
2.2. The Impact of XP Practices on Software Productivity and Quality
2.3. Bayesian Network Modelling
-
Model Design
3.1. Model Overview
3.2. Team Velocity Model
3.3. Defected Story Points Model
-
Model Validation
4.1. Experiments Setup
4.2. Results and Discussion
-
Conclusions and References
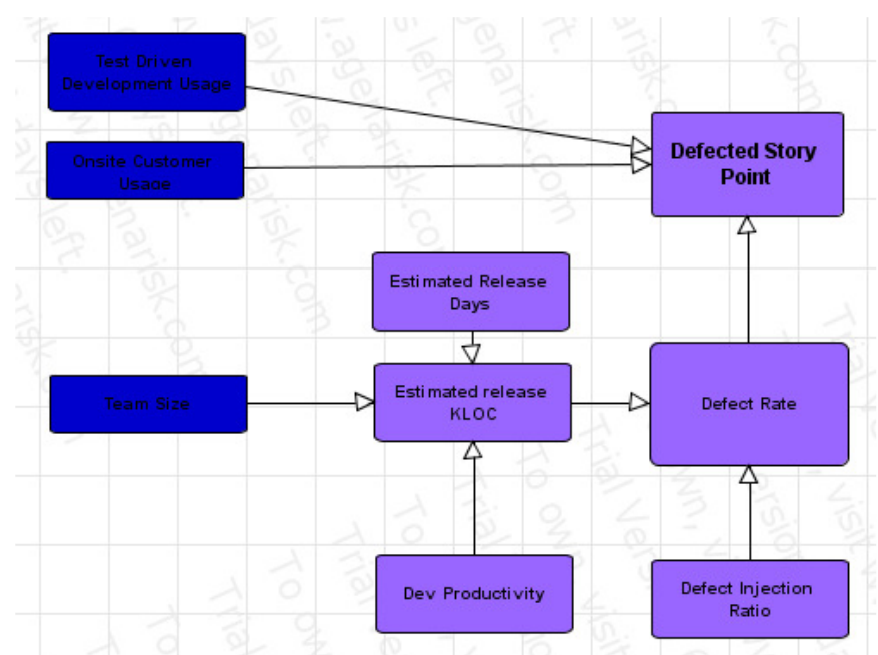
3.3. Defected Story Points Model
This model calculates an estimate number for the defected story points to be redeveloped in the next release. This number is affected by two XP practices: Test Driven development and Onsite Customer practices. Different components of the model are described as follows:
\
-
Dev. Productivity: The developer productivity measured as the number Line Of Code (LOC) per day. According to the literature [4], a normal distribution with mean 40 and Standard Deviation of 20 represents this value.
\
-
Estimated Release KLOC: represents the number of KLOC produced from this release. This value is calculated as the product of multiplying Dev. Productivity times Team size times Estimated Release Days.
\
-
Defect Injection Ratio: represents the number of defects per KLOC. This value was set to a normal distribution with mean 20 and standard deviation 5 [4].
\
-
Defect Rate: represents the number of defects in this release. It is calculated as the multiplication of the Estimated Release KLOC times Defect Injection Ratio.
\
-
Defected Story Points: This value represents the number of defected story points to be re-developed in the next release taking into account the impact of two XP practices: Test Driven development and Onsite Customer practices (Equation 3). OSCImpactFactor and TDDImpactFactor represent the impact of the Onsite Customer and Test Driven development practices on reducing the defect rate. According to the literature, there values were set to 0.8 and 0.4 respectively [3],[4]. More details regarding the impact of these practices in the defect rate are available in the Background section.
\ DefectedStoryPoints = DefectRate*(1- OSCImpactFactor * onsitecustomerusage )*(1 TDDImpactFactor *tddusage) Equation (3)
\ 
\
:::info Authors:
(1) Mohamed Abouelelam, Software System Engineering, University of Regina, Regina, Canada;
(2) Luigi Benedicenti, Software System Engineering, University of Regina, Regina, Canada.
:::
:::info This paper is available on arxiv under CC BY-NC-ND 4.0 DEED license.
:::
\


You May Also Like

Bitcoin’s Quantum Vulnerability: Poor Wallet Habits Expose 4.12 Million BTC

Rape joke by Bacolod broadcaster sparks outrage, suspension

SGX FX Partners With Chainlink to Bring OTC FX Data Onchain


