Boosting Anatomical Retrieval Accuracy with Re-Ranking Methods
Table of Links
Abstract and 1. Introduction
-
Materials and Methods
2.1 Vector Database and Indexing
2.2 Feature Extractors
2.3 Dataset and Pre-processing
2.4 Search and Retrieval
2.5 Re-ranking retrieval and evaluation
-
Evaluation and 3.1 Search and Retrieval
3.2 Re-ranking
-
Discussion
4.1 Dataset and 4.2 Re-ranking
4.3 Embeddings
4.4 Volume-based, Region-based and Localized Retrieval and 4.5 Localization-ratio
-
Conclusion, Acknowledgement, and References
3.2 Re-ranking
This section presents the retrieval recalls after applying the re-ranking method of Section 2.5.
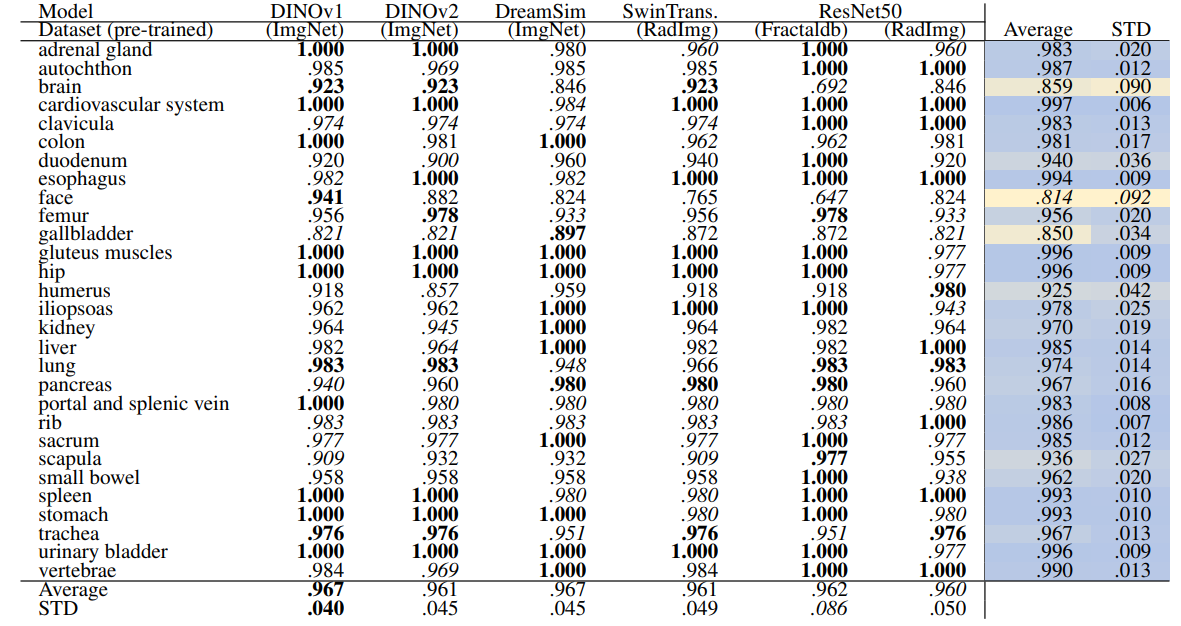
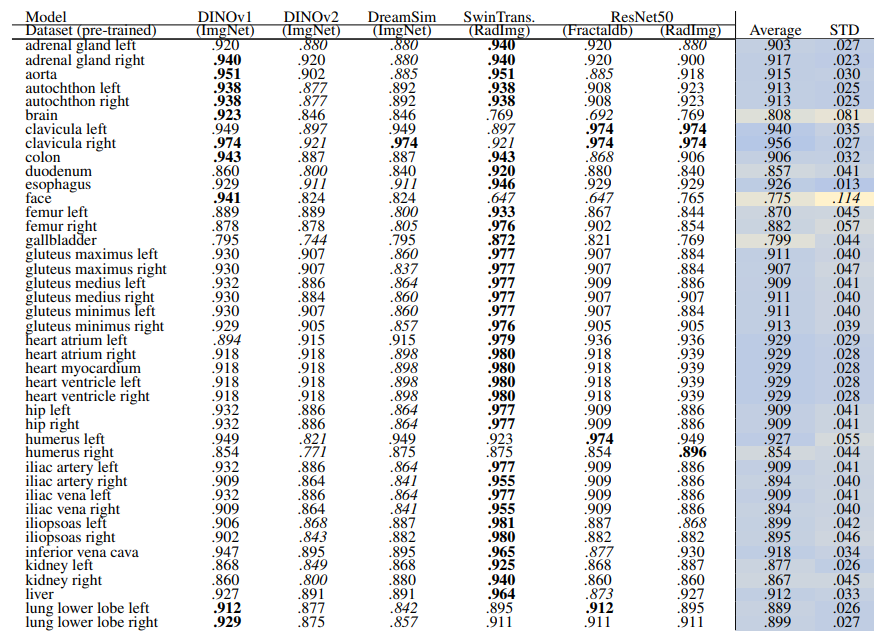
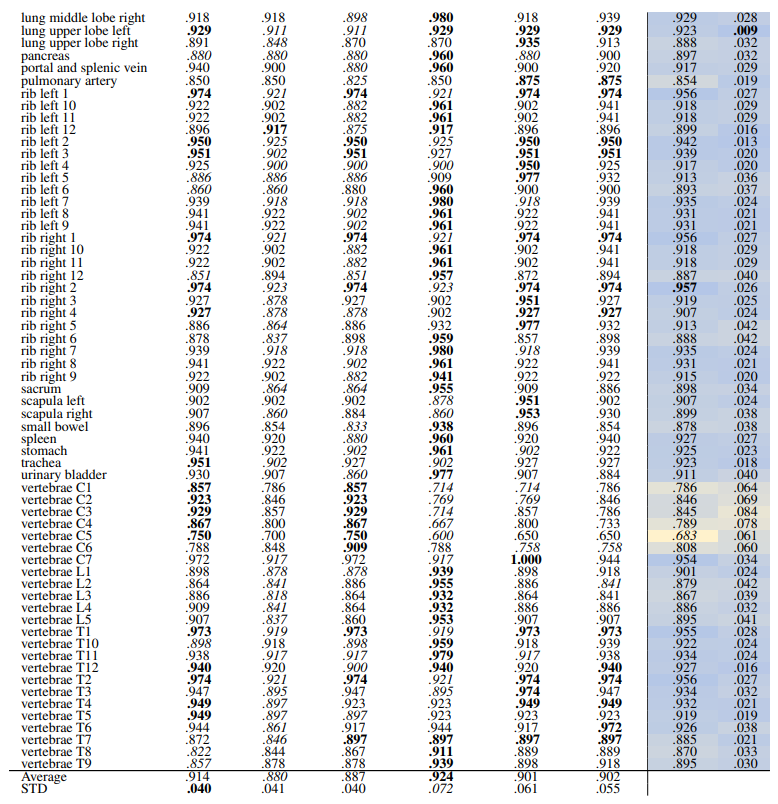
\ 3.2.1 Volume-based
\ Table 12 and Table 13 show the retrieval recalls for 29 coarse anatomical structures and 104 original TS anatomical structures using the proposed re-ranking method. All the recalls are improved using re-ranking. The performance of the models for 29 classes is close with only slight differences. DINOv1 and DreamSim have a slightly better recall in comparison, with an average recall of .967 but the standard deviation of DINOv1 is slightly lower (.040 vs. .045). In 104 anatomical regions, SwinTransformer performs better than the other models with an average recall of .924 but its standard deviation (.072) is the lowest.
\ 
\ 
\ 
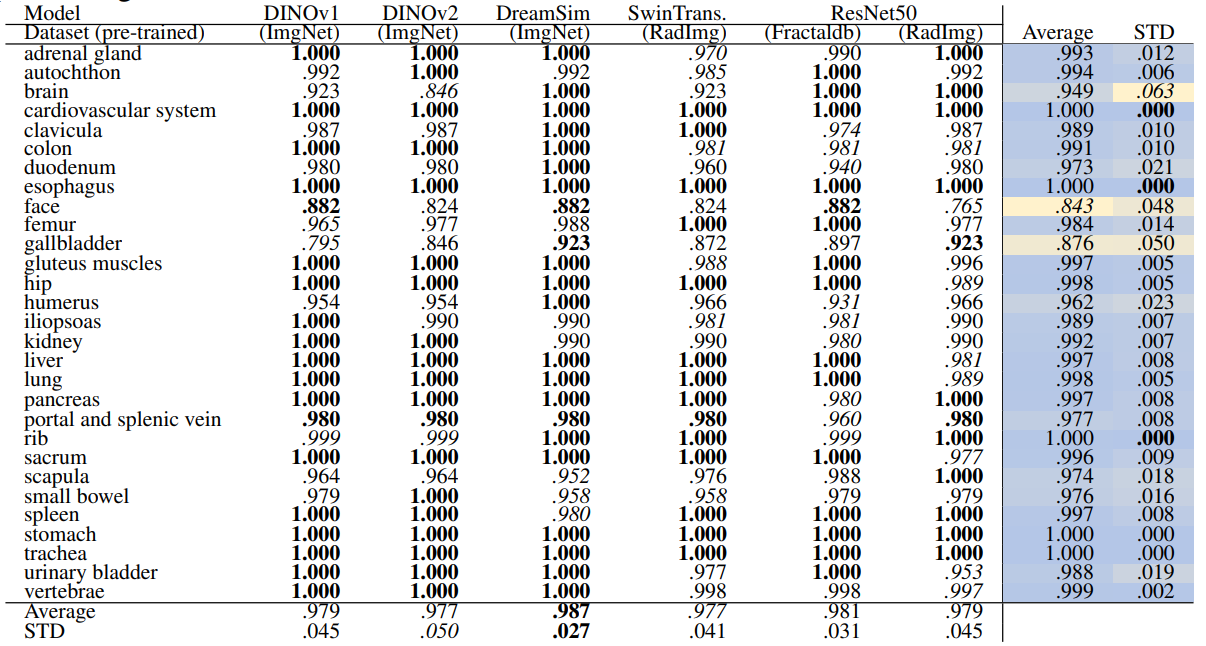
\ 3.2.2 Region-based
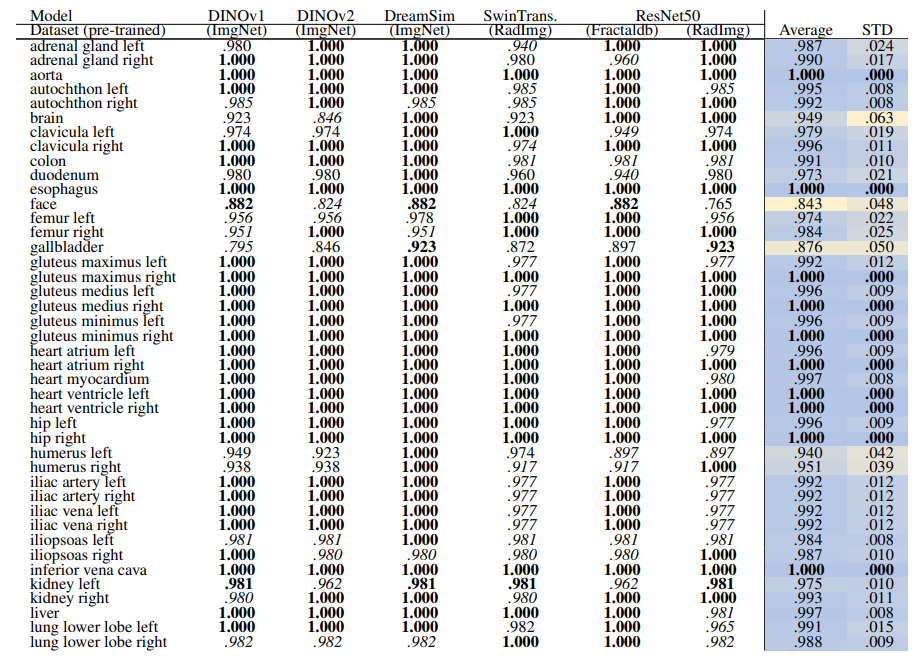
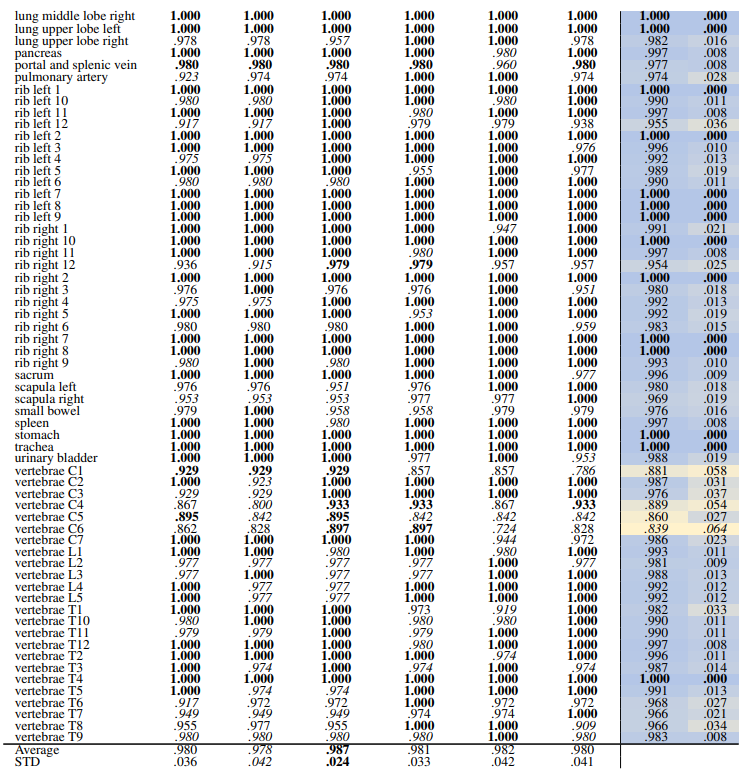
\ Table 14 and Table 15 show the retrieval recall for 29 coarse anatomical structures and 104 original TS anatomical structures employing the proposed re-ranking method. Using the re-ranking, the overall performance of all the models has improved. DreamSim performs the best with the average retrieval recall of .987 ± .027 and .987 ± .024 for 29 and 104 classes, respectively. There are only slight variations between the performance on coarse and all the original TS classes. Similar to the count-based method in the anatomical region retrieval many classes are perfectly retrieved (recall of 1.0). There is a low variation among models and between classes where the highest standard deviation is .064 and .042.
\ 
\ 
\ 
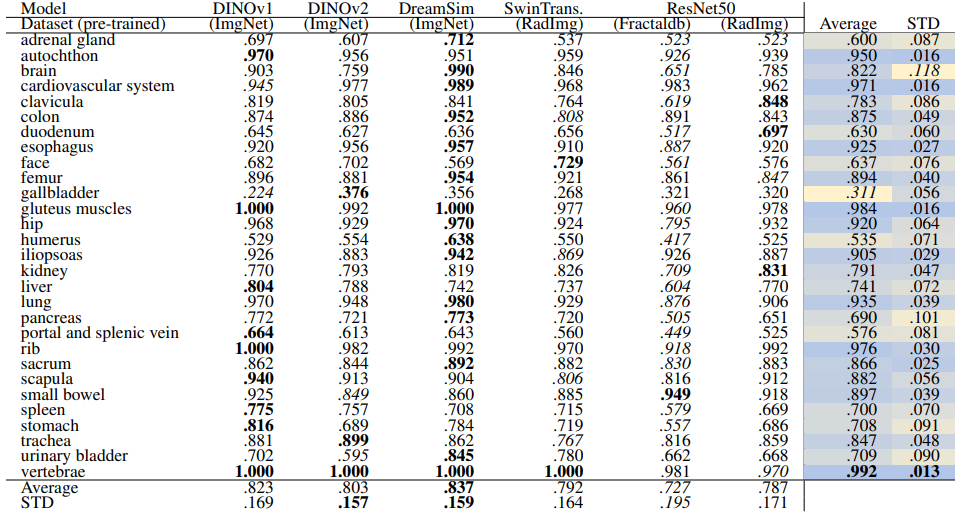
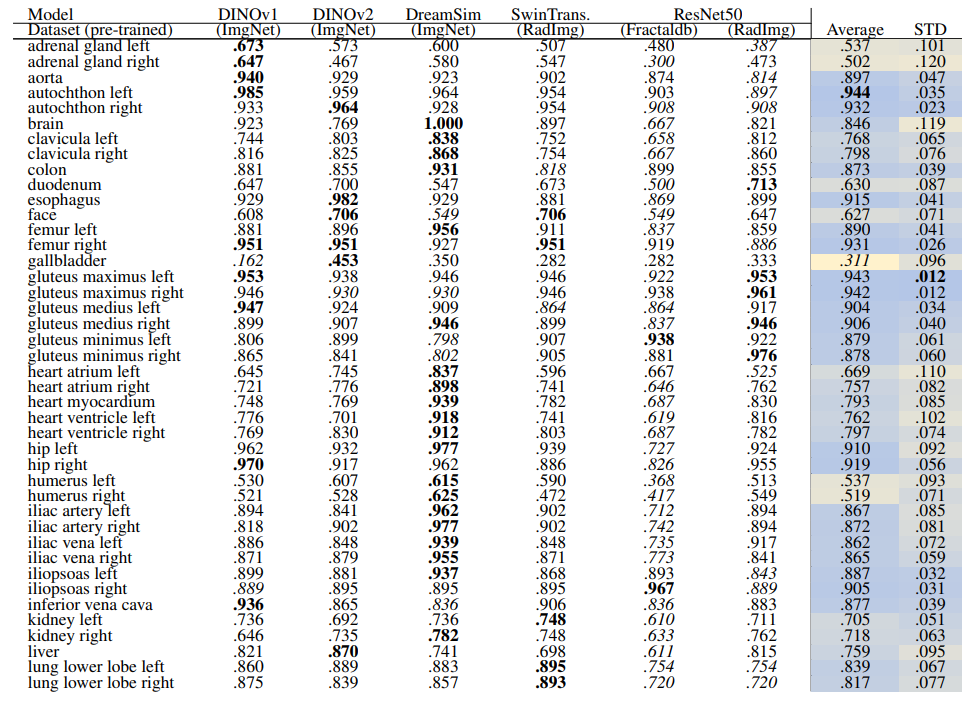
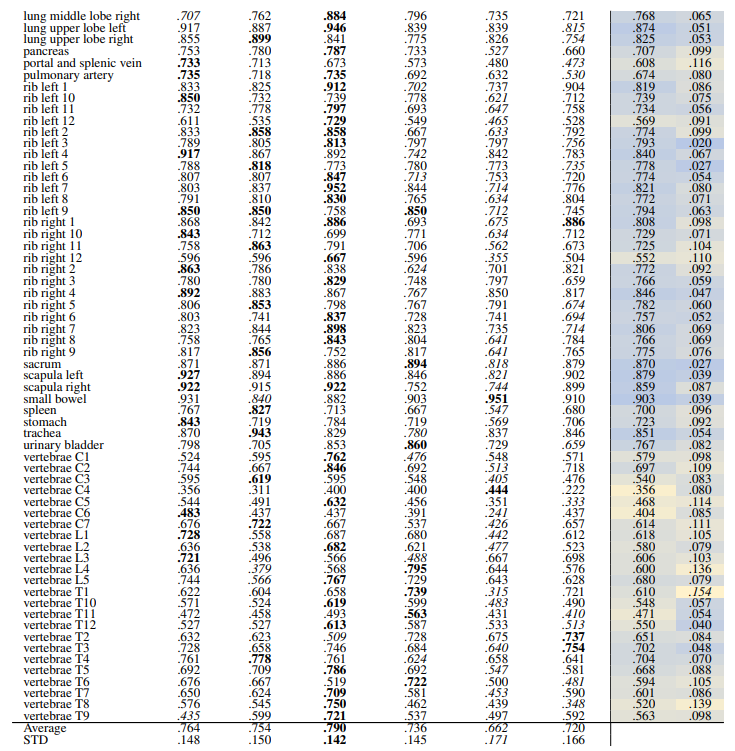
\ 3.2.3 Localized
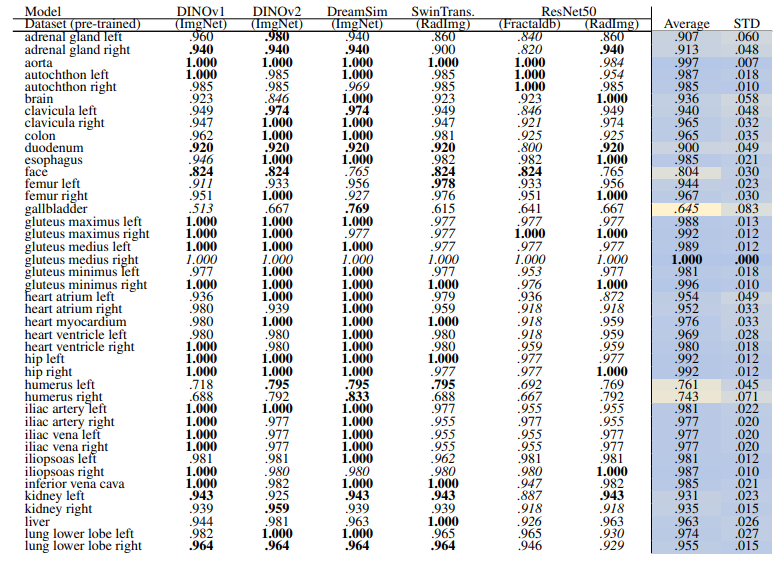
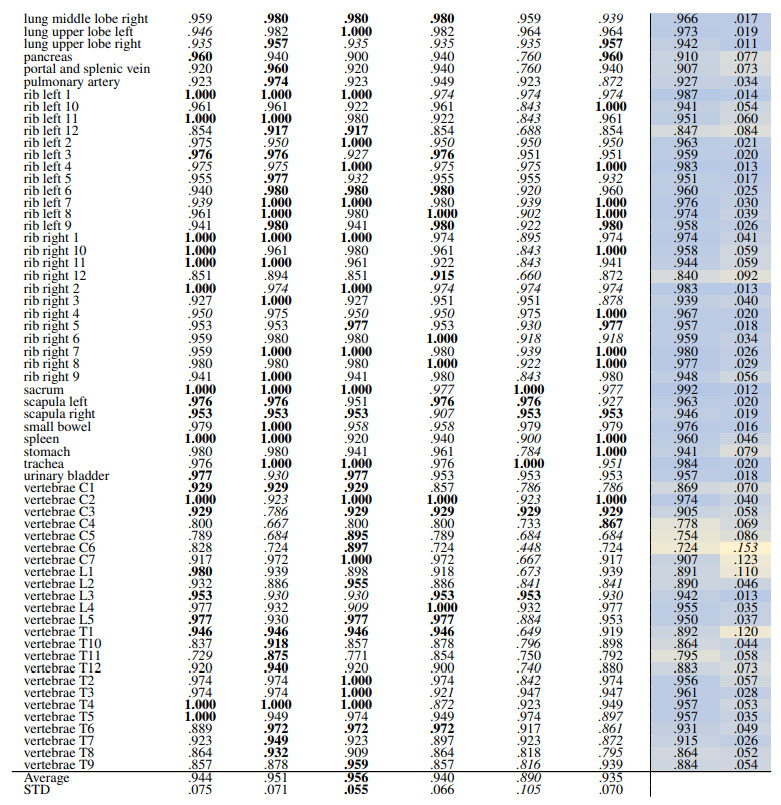
\ Localized Retrieval Recall Table 16 and Table 17 show the retrieval recall for 29 coarse anatomical structures and 104 original TS anatomical structures after re-ranking for L = 15. Re-ranking improved the localization for all the models. DreamsSim is the best-performing model with an average recall of .955 ± .062 for coarse anatomical structures and .956 ± .055 for original TS classes. Although the retrieval is lower compared to region-based or volume-based evaluation, it is still high which shows that the pretrained vision embeddings not only can retrieve similar cases but also can localize the corresponding region of interest.
\ 
\ 
\ Localization-ratio The localization-ratio is calculated based on (7). Table 18 and Table 19 demonstrate the localization-ratio for 29 coarse and 104 original TS anatomical regions after re-ranking for L = 15. The bestperforming embedding is still DreamSim with a localization-ratio of .837 ± .159 and .790 ± .142 for 29 coarse and 104 original TS classes. After re-ranking the overall localization-ratio is reduced (previously, .864 ± .0145 and .803 ± .130, respectively).
\ 
\ 
\ 
\
:::info Authors:
(1) Farnaz Khun Jush, Bayer AG, Berlin, Germany ([email protected]);
(2) Steffen Vogler, Bayer AG, Berlin, Germany ([email protected]);
(3) Tuan Truong, Bayer AG, Berlin, Germany ([email protected]);
(4) Matthias Lenga, Bayer AG, Berlin, Germany ([email protected]).
:::
:::info This paper is available on arxiv under CC BY 4.0 DEED license.
:::
\


You May Also Like

Elon Musk trial on track as Washington securities case

OpenVPP accused of falsely advertising cooperation with the US government; SEC commissioner clarifies no involvement