

Bitcoin vs Gold Chart Suggests Bear Market May Be Ending
Crypto analyst Michaël van de Poppe has pointed to the Bitcoin versus gold chart as what he calls “the best chart in the ecosystem,” arguing that it tells a very different story than Bitcoin’s performance against the U.S. dollar.
According to him, the key metric is not Bitcoin’s valuation in dollars, which he believes will trend upward over time, but its relative strength against gold, since both are considered hard assets.
 Source: https://x.com/CryptoMichNL/status/2025155789087014989
Bitcoin vs Gold at Historic Lows
Van de Poppe highlighted that Bitcoin’s valuation relative to gold is currently at its lowest level ever.
While many investors believe the market is only a few months into a bear phase, following Bitcoin’s dollar-denominated all-time high in October 2025, he argues the BTC/Gold chart suggests otherwise.
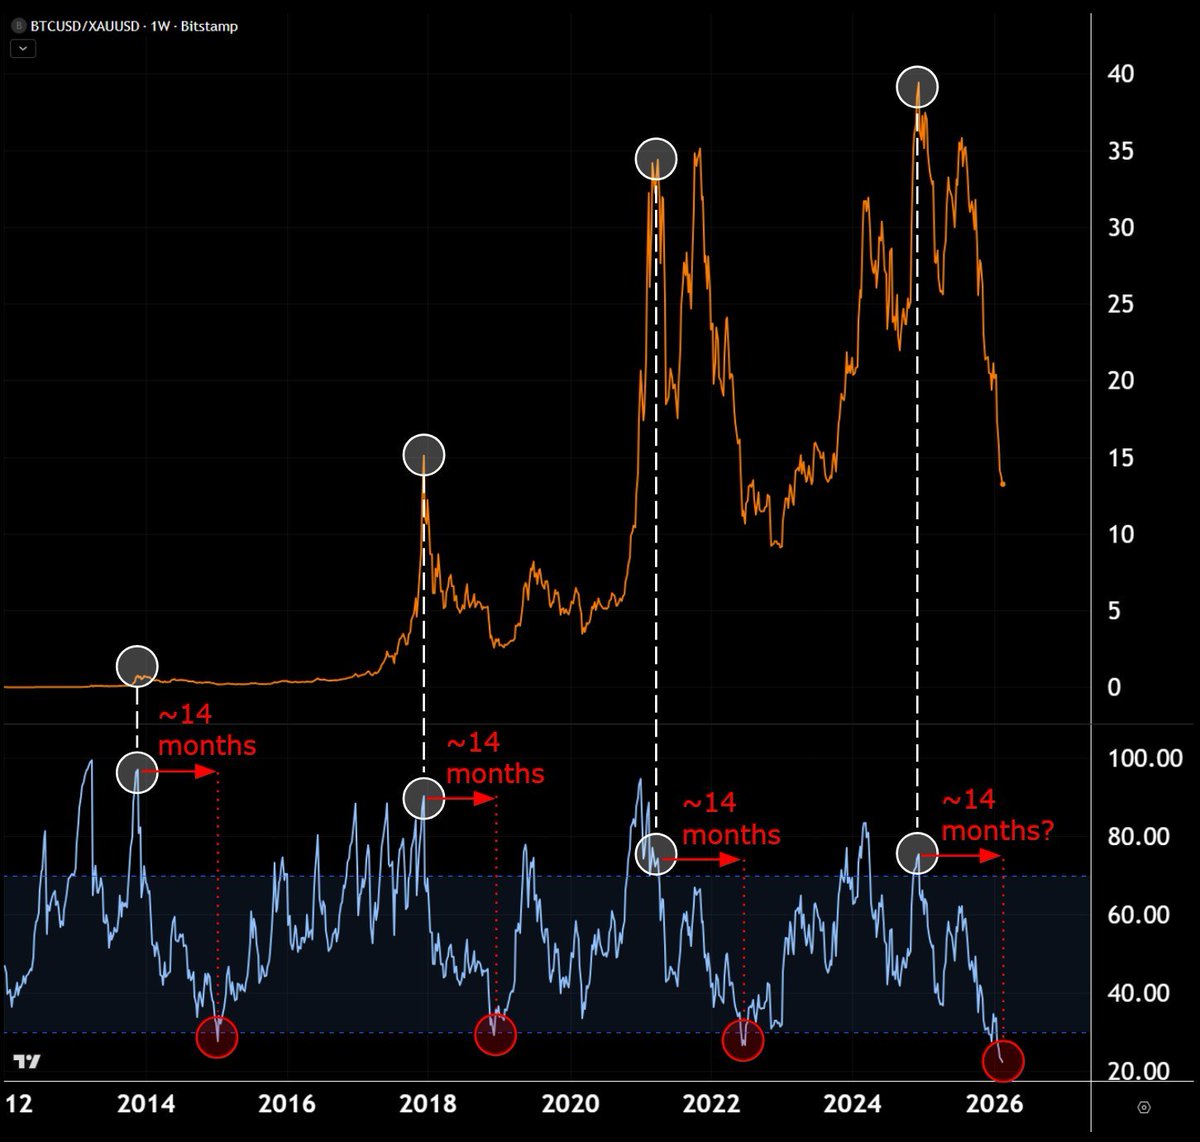
In his view, Bitcoin actually peaked relative to gold in December 2024. That would imply the market has already been in a bear cycle for approximately 14 months.
Historical Pattern Repeating?
He notes that previous bear markets measured in BTC/Gold terms lasted roughly 14 months:
- November 2013 to January 2015
- December 2017 to February 2019
- April 2021 to June 2022
In each instance, the weekly RSI on the BTC/Gold chart bottomed near extreme lows before a multi-year uptrend followed.
According to van de Poppe, the current weekly RSI is now at its lowest level in history, aligning with prior cycle bottoms.
Rethinking the October 2025 All-Time High
The analyst also reframed Bitcoin’s October 2025 dollar all-time high.
He suggested that the move may not have reflected genuine Bitcoin strength. Instead, he argued it may have been driven largely by gold and silver rallying strongly, lifting Bitcoin’s dollar price along with broader hard asset appreciation.
When priced in gold rather than dollars, Bitcoin has been in decline for over a year.
Final Chapter of the Bear Market?
Van de Poppe concluded that instead of being at the beginning of a bear market, Bitcoin may be in its final phase.
Historically, extreme lows in the BTC/Gold RSI have preceded extended periods of upward momentum. From his perspective, betting on significant downside from current levels would require assuming that this historically stretched ratio continues deteriorating.
He maintains that similar moments in previous cycles proved to be strong long-term entry points, suggesting the current setup could follow a comparable pattern.
The post Bitcoin vs Gold Chart Suggests Bear Market May Be Ending appeared first on ETHNews.


You May Also Like

How Bitcoin Mining Becomes the Hardest Defense System for Your Wealth

Ripple (XRP) vs Solana (SOL): Which Altcoin Has Greater Potential in Q2 2026?


