The post Crypto Market Update Today: BTC and ETH Slide Below Key Levels—Is More Downside Ahead? appeared first on Coinpedia Fintech News The crypto market is downThe post Crypto Market Update Today: BTC and ETH Slide Below Key Levels—Is More Downside Ahead? appeared first on Coinpedia Fintech News The crypto market is down

Crypto Market Update Today: BTC and ETH Slide Below Key Levels—Is More Downside Ahead?

2026/02/23 15:51
3 min read
Crypto Faces Record $28B Options Expiry Today

The post Crypto Market Update Today: BTC and ETH Slide Below Key Levels—Is More Downside Ahead? appeared first on Coinpedia Fintech News

The crypto market is down today. The Bitcoin price marked an intraday low of around $64,290 from its highs at $67,684, a plunge of over 4.6%. On the other hand, Ethereum also underwent a similar plunge from $1,957 to $1,848 after holding the support at $1,914 for nearly a week. The market dropped by 4.31% to $2.23 trillion in the past 24 hours, primarily driven by a massive liquidation cascade in Bitcoin derivatives.

crypto liquidation

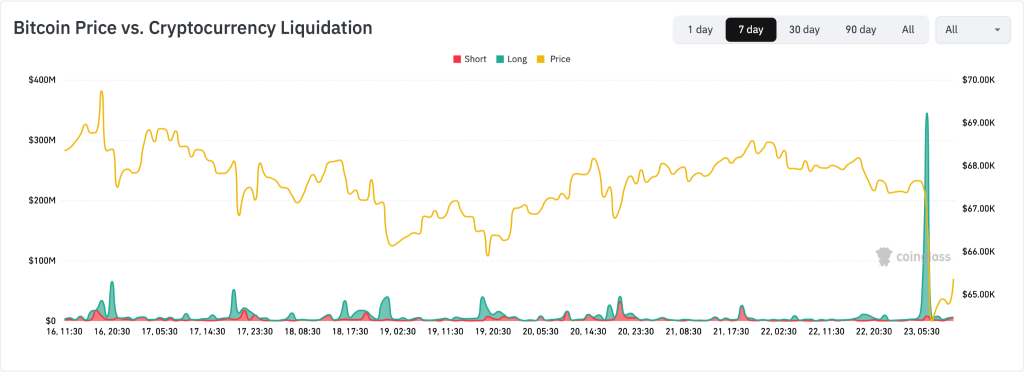
Bitcoin long liquidations surged 934% in the past 24 hours to $211 million, with over $200 million in crypto longs liquidated in just one hour as BTC neared $65,000. This indicates an overleveraged market where forced selling amplified the downturn. The cascade created a feedback loop, and falling prices triggered more liquidations, which pushed prices lower, affecting all correlated assets. 

Altcoins Display Strength – PIPPIN Price Leads the Top Gainers

 As a result, the altcoins were also negatively affected, with tokens in the top 10 plunging significantly. Solana underwent a massive pullback as it lost the crucial $80 support, reaching $77.43 with a nearly 9% pullback. Besides, XRP, Dogecoin, & Bitcoin Cash experienced over a 5% drop each, reaching $1.34, $0.092 and $539.07, respectively. With this, the altcoin market cap also plunged below $940 billion, marking lows close to $910 billion. 

altcoin

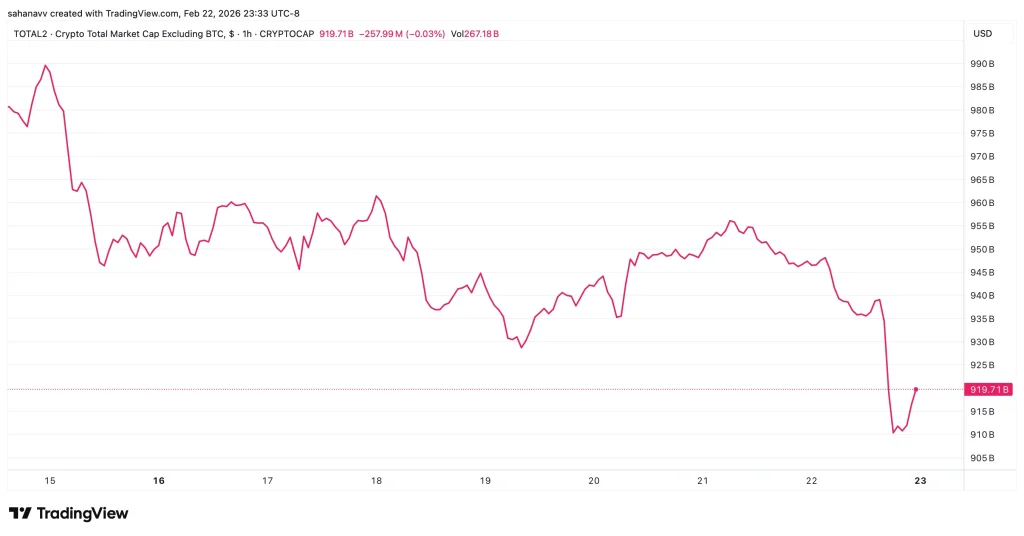
The market cap consolidated between $935 billion and $955 billion for a few days after losing the local highs close to $990 billion. The latest drop seems to have broken the ascending consolidation, raising the possibility of a deeper correction. The altcoins like LayerZero and pump.fun lead the losers with a 10.21% and 8.72% drop, respectively. On the other hand, the price of Pippin continues to rise with a nearly 34.36% jump, followed by the price of Kite with an 18.30% rise and Memecore & Toncoin with over a 2% jump. 

USDT Liquidity Turns Negative—Warning Signal for Bitcoin?

This CryptoQuant chart tracks the 60-day change in USDT market cap alongside Bitcoin’s price. Historically, strong expansions in USDT supply (purple area rising) have aligned with bullish Bitcoin phases, signaling fresh liquidity entering the market. Conversely, when the 60-day change flips negative, liquidity contracts—and Bitcoin tends to struggle.

USDT

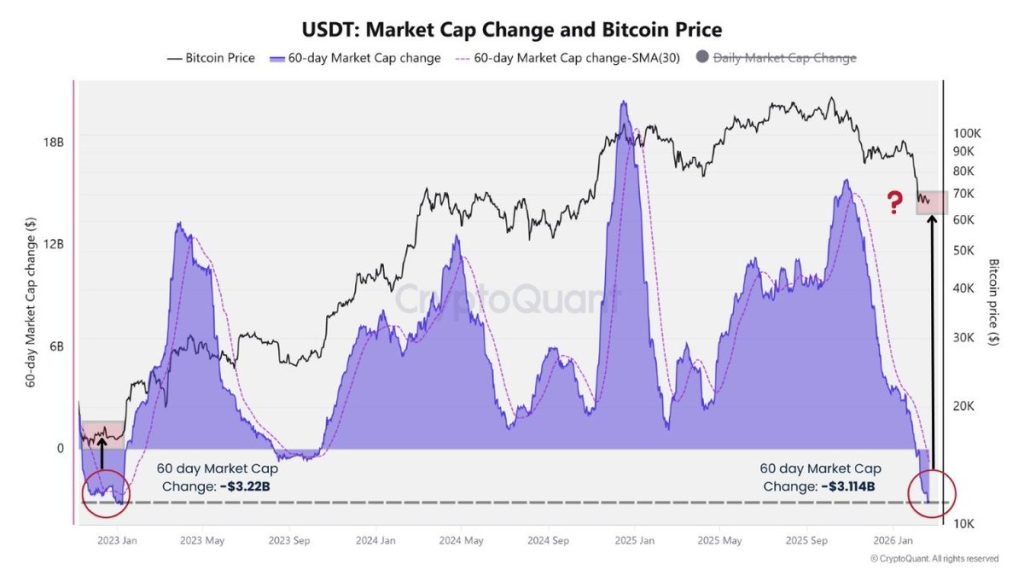
Right now, the 60-day USDT market cap change has dropped to around –$3.1 billion, a level previously seen near local market bottoms in early 2023. The question mark highlights uncertainty: will this liquidity drain mark another short-term bottom or signal deeper weakness? If stablecoin inflows don’t recover soon, Bitcoin may face continued pressure before any sustainable rebound.

The Bottom Line: What to Expect Next?

The sell-off was ignited by a violent unwinding of leveraged Bitcoin positions, compounded by the Ethereum ecosystem plunging nearly 20%, significantly underperforming the broader market. The immediate path depends on Bitcoin price holding $65,000 and the total crypto market cap staying above its critical yearly low of $2.17 trillion. The next key macro catalyst is the release of daily ETF flow data, which will highlight the institutional interest.
Therefore, the next few days until the end of the monthly trade can be considered as an important phase to determine the next course of action of the crypto markets & BTC price. 

Market Opportunity
Ucan fix life in1day Logo
Ucan fix life in1day Price(1)
$0.0009022
$0.0009022$0.0009022
+5.94%
USD
Ucan fix life in1day (1) Live Price Chart
Disclaimer: The articles reposted on this site are sourced from public platforms and are provided for informational purposes only. They do not necessarily reflect the views of MEXC. All rights remain with the original authors. If you believe any content infringes on third-party rights, please contact [email protected] for removal. MEXC makes no guarantees regarding the accuracy, completeness, or timeliness of the content and is not responsible for any actions taken based on the information provided. The content does not constitute financial, legal, or other professional advice, nor should it be considered a recommendation or endorsement by MEXC.

You May Also Like

XRP stuck in range as descending channel caps upside momentum

XRP stuck in range as descending channel caps upside momentum

XRP slid ~3% in 24h, stuck in a descending channel after failed breakout. Ripple’s XRP (XRP) token declined alongside broader cryptocurrency markets on Monday,
Share
Crypto.news2026/02/23 18:18
Microsoft Corp. $MSFT blue box area offers a buying opportunity

Microsoft Corp. $MSFT blue box area offers a buying opportunity

The post Microsoft Corp. $MSFT blue box area offers a buying opportunity appeared on BitcoinEthereumNews.com. In today’s article, we’ll examine the recent performance of Microsoft Corp. ($MSFT) through the lens of Elliott Wave Theory. We’ll review how the rally from the April 07, 2025 low unfolded as a 5-wave impulse followed by a 3-swing correction (ABC) and discuss our forecast for the next move. Let’s dive into the structure and expectations for this stock. Five wave impulse structure + ABC + WXY correction $MSFT 8H Elliott Wave chart 9.04.2025 In the 8-hour Elliott Wave count from Sep 04, 2025, we saw that $MSFT completed a 5-wave impulsive cycle at red III. As expected, this initial wave prompted a pullback. We anticipated this pullback to unfold in 3 swings and find buyers in the equal legs area between $497.02 and $471.06 This setup aligns with a typical Elliott Wave correction pattern (ABC), in which the market pauses briefly before resuming its primary trend. $MSFT 8H Elliott Wave chart 7.14.2025 The update, 10 days later, shows the stock finding support from the equal legs area as predicted allowing traders to get risk free. The stock is expected to bounce towards 525 – 532 before deciding if the bounce is a connector or the next leg higher. A break into new ATHs will confirm the latter and can see it trade higher towards 570 – 593 area. Until then, traders should get risk free and protect their capital in case of a WXY double correction. Conclusion In conclusion, our Elliott Wave analysis of Microsoft Corp. ($MSFT) suggested that it remains supported against April 07, 2025 lows and bounce from the blue box area. In the meantime, keep an eye out for any corrective pullbacks that may offer entry opportunities. By applying Elliott Wave Theory, traders can better anticipate the structure of upcoming moves and enhance risk management in volatile markets. Source: https://www.fxstreet.com/news/microsoft-corp-msft-blue-box-area-offers-a-buying-opportunity-202509171323
Share
BitcoinEthereumNews2025/09/18 03:50
Why informal crypto markets offer a 1–2% premium?

Why informal crypto markets offer a 1–2% premium?

Photo by CoinWire Japan on Unsplash And why that premium is not “free money” Scroll through OTC chats, WhatsApp brokers, or hawala-adjacent crypto de
Share
Medium2026/02/23 18:38