

Tron Crypto (TRXUSDT): Price Paused at a Knife‑Edge as Market Sits in Extreme Fear

While the broader crypto market leans risk‑off, Tron crypto (TRXUSDT) is holding a tight range at a critical equilibrium level.
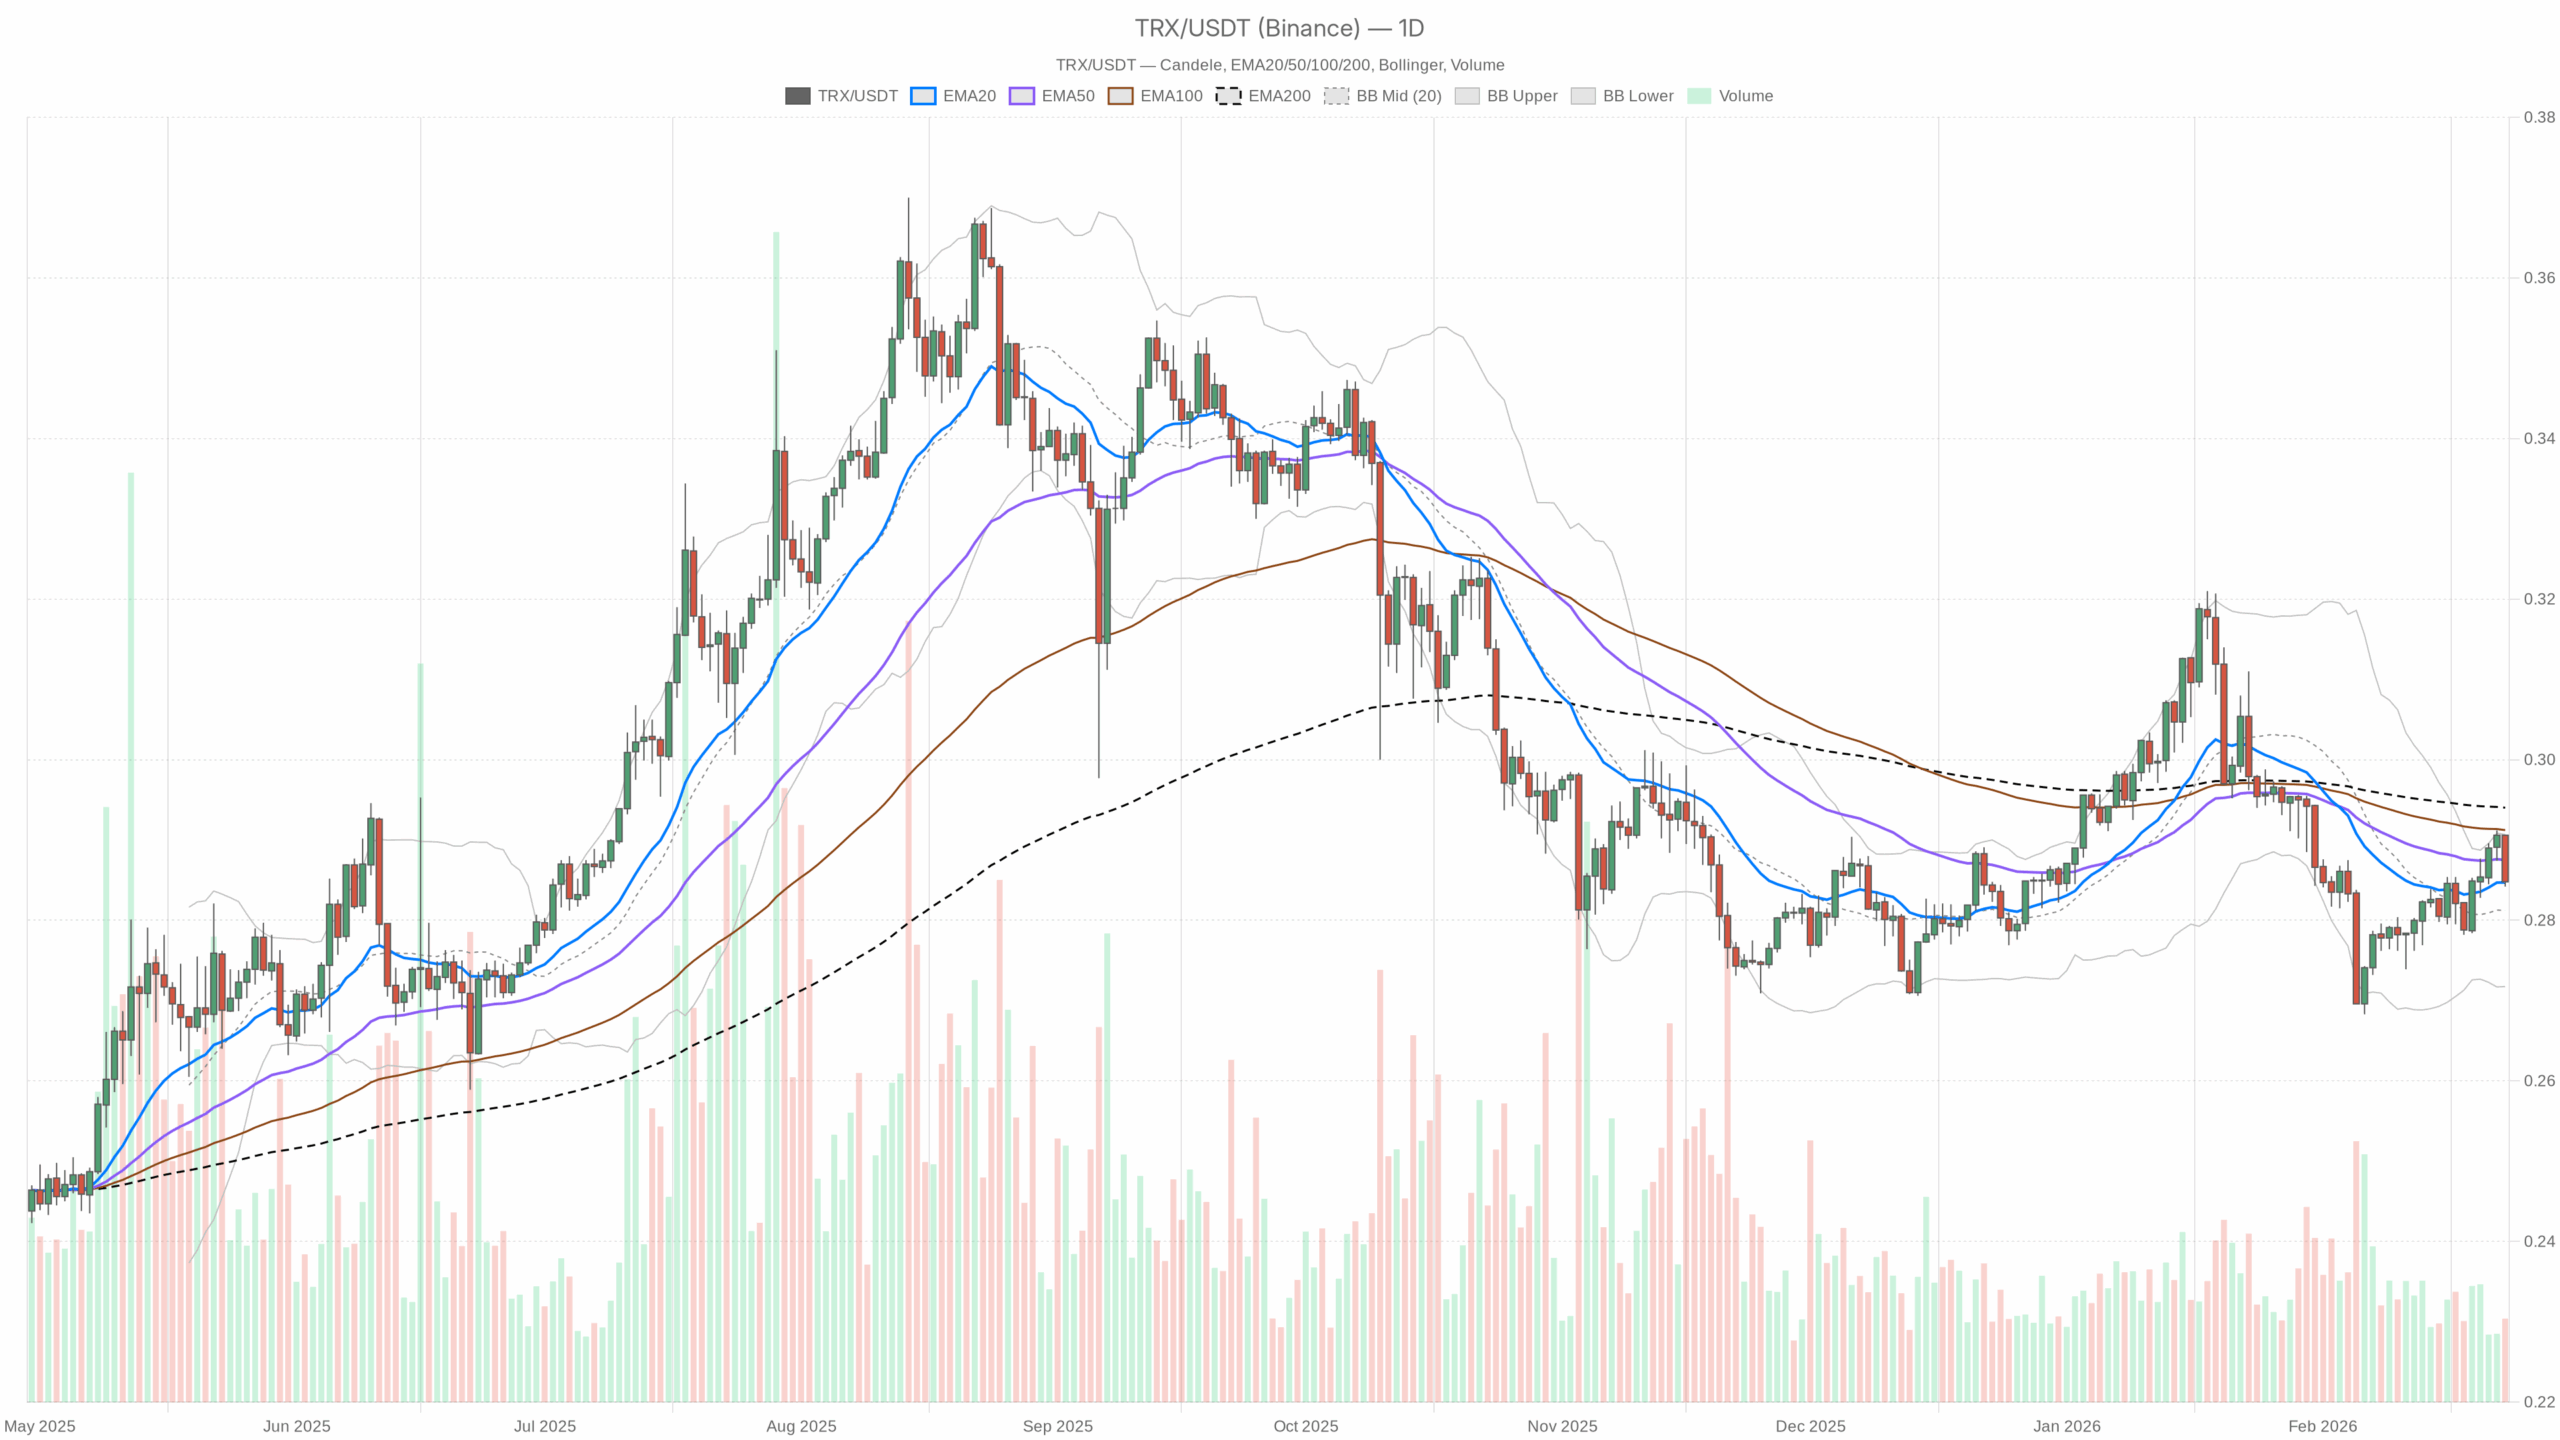 TRX/USDT — daily chart with candlesticks, EMA20/EMA50 and volume.
Tron Crypto (TRXUSDT): Stuck at the Fulcrum While the Market Panics
Tron’s TRXUSDT is sitting right on the fence. On the daily chart the price is glued around $0.28, exactly at the 20‑day EMA and mid‑Bollinger band, with the 50‑ and 200‑day EMAs just above at $0.29. That is classic equilibrium: the prior uptrend has stalled, but sellers have not taken control either. What makes this moment important is the backdrop: global crypto is down about 1.4% on the day, BTC dominance is high at ~56%, and the fear & greed index is pinned at Extreme Fear (5/100). Risk appetite is low, yet TRX is holding structure instead of capitulating.
The dominant force here is not momentum – it is positioning. In an environment where capital is hiding in BTC and stablecoins, TRX hovering near recent averages suggests the market is undecided rather than outright bearish. This is exactly where mean‑reversion traders and trend followers usually clash. One side is betting on a bounce from support, and the other on a slow bleed back toward prior lows. So far, neither side has a clear win.
Given the daily setup and the indicator mix, the main scenario for now is neutral with a slightly defensive bias. The broader market fear and weak intraday momentum lean mildly bearish. However, the daily structure has not broken down, so calling a full bearish trend would be premature.
Daily Chart (D1): Macro Bias – Neutral, Edge to the Downside
Price vs EMAs
– Close: $0.28
– EMA 20: $0.28
– EMA 50: $0.29
– EMA 200: $0.29
Price is locked onto the 20‑day EMA and just below both the 50‑day and 200‑day EMAs. When price lives under the 50/200 but has not been rejected hard, it usually signals a market that has lost upside momentum but has not flipped into a firm downtrend yet. Bulls no longer have a strong trend, but bears still need a decisive push to take over.
RSI (14): 49.19
RSI is dead center, basically neutral. There is no sign of exhaustion on either side. This supports the idea that TRX is in balance: no clear accumulation, but also no panic liquidation. It is a waiting game.
MACD:
– MACD line: ~0
– Signal line: ~0
– Histogram: ~0
MACD flattened at zero is the definition of a trendless market. TRX is not showing meaningful bullish or bearish momentum on the daily; it is consolidating. That tells you any directional move from here can accelerate quickly once a break actually occurs, because traders are under‑positioned in both directions.
Bollinger Bands (20,2):
– Mid band: $0.28
– Upper band: $0.29
– Lower band: $0.27
Price is parked near the mid band, with a relatively tight band span between $0.27 and $0.29. That is volatility compression. Historically, after a squeeze like this, TRX does not stay quiet for long and it tends to break out into a more directional move. Right now, there is no edge on direction from Bollinger alone. However, what it does say is that volatility is likely to expand from these levels.
ATR (14): ~0 (effectively very low)
ATR reading close to zero in this feed reflects a period of extremely low realized volatility. In practice, daily ranges have been compressed. This aligns with the tight Bollinger bands: the market is coiling. When volatility has been this subdued, traders should expect larger candles ahead, whether up or down.
Daily Pivot Levels:
– Pivot Point (PP): $0.29
– Resistance 1 (R1): $0.29
– Support 1 (S1): $0.28
The current price at $0.28 is sitting near the first support pivot (S1), while the pivot and first resistance are both at $0.29. It is a tight band, reinforcing the idea that we are in a narrow consolidation zone. Bulls need to retake and hold above $0.29 to show any kind of authority. Bears want to push sustained closes below $0.28 to open a deeper move.
Overall, the daily chart says: trend is indecisive, volatility is suppressed, and the next real move will likely be impulsive once the range breaks.
1‑Hour Chart (H1): Short‑Term Pressure, But Not a Breakdown
Price vs EMAs
– Close: $0.28
– EMA 20: $0.29
– EMA 50: $0.29
– EMA 200: $0.28
On the 1‑hour chart, price is pinned under the 20 and 50 EMAs, with the 200 EMA sitting almost exactly at price. That is intraday downward pressure within a flat higher‑timeframe structure. Short‑term traders have been selling rallies, but the longer‑term average (200 EMA) has not rolled over aggressively yet. This usually precedes either a break lower, if sellers stay in control, or a classic mean reversion to the 50 EMA bounce.
RSI (14): 31.54
RSI on H1 is leaning into oversold territory, but not in capitulation. That often marks a late stage of a short‑term downswing. Intraday sellers are in control, yet they are starting to run into value buyers and short‑covering interest. It does not guarantee a bounce, but it makes aggressive fresh shorts less attractive at current levels.
MACD: MACD line, signal, and histogram all near 0
Despite the RSI pressure, MACD is basically flat. That means the hourly selling has not produced a strong momentum trend; it is more of a grind lower inside a range. Combined with the daily MACD, we are looking at an asset that is drifting, not trending.
Bollinger Bands:
– Mid band: $0.29
– Upper band: $0.29
– Lower band: $0.28
Price is near the lower band. Intraday, that is where mean‑reversion traders usually start to nibble. With bands narrow and price hugging the low side, the risk/reward begins to favor a short‑term bounce rather than pressing shorts, unless the market is about to transition from range to trend with a breakdown.
Hourly Pivot Levels:
– PP: $0.28
– R1: $0.28
– S1: $0.28
Hourly pivots are compressed right around the current price, which tells you the market has been chopping around this level without strong intraday directional structure. It is a noisy zone, not clean trend territory.
In short, H1 leans softly bearish, but without conviction. It confirms weakness in the very short term, yet it does not show the kind of momentum you want to see for a high‑confidence breakdown.
15‑Minute Chart (M15): Execution Timeframe – Local Bearish Regime
Price vs EMAs
– Close: $0.28
– EMA 20: $0.29
– EMA 50: $0.29
– EMA 200: $0.29
On M15, price is clearly below all the key EMAs, and the system tags this regime as bearish. Intraday structure is weak; bounces are being sold, and the path of least resistance in the very short term is still down until price can reclaim at least the 20‑EMA on this timeframe.
RSI (14): 28.10
RSI is oversold on the 15‑minute chart. In an already fearful macro environment, that often produces sharp but short‑lived counter‑moves. For execution, this is where late sellers tend to get punished if they chase further downside without a confirmed breakdown on the higher timeframes.
MACD: near 0 again
Even on M15, MACD is not showing a strong trend pulse. Price is grinding lower, not collapsing. It is controlled selling within a narrow band.
Bollinger Bands:
– Mid band: $0.29
– Upper band: $0.29
– Lower band: $0.28
Price is pinned near the lower band, echoing the H1 picture. For scalpers, this is usually a high‑risk area to initiate new shorts, because you are leaning into stretched intraday conditions in a low‑volatility environment.
15‑Minute Pivots:
– PP: $0.28
– R1: $0.28
– S1: $0.28
Again, pivots are essentially on top of price, highlighting just how compressed and noisy this microstructure is.
Cross‑Timeframe Takeaways
– Daily (D1): Neutral, coiling just under medium‑term averages. No decisive trend, low volatility, bands tight.
– Hourly (H1): Mild downside pressure, but no strong momentum. RSI nearing oversold, price under fast EMAs.
– 15‑Minute (M15): Local bearish regime with oversold conditions and price sitting on the lower bands.
The tension here is clear: the structure on the daily is balanced, but momentum intraday is skewed lower. Combined with Extreme Fear in the broader crypto market and elevated BTC dominance, the path of least resistance is a cautious drift lower unless buyers step up around $0.28.
Market Context: Risk‑Off, but Tron Is Resilient
Total crypto market cap is about $2.35T, down roughly 1.4% in the last 24 hours. BTC dominance is strong at around 56.3%, and Tron holds about 1.15% of total crypto market cap. This is a classical risk‑off setup, with money gravitating to BTC and stablecoins and alts under pressure.
Despite that, TRX is not breaking structure. DEX activity on Tron (SUNSwap variants) shows declining 30‑day fees, hinting at a slowdown in on‑chain speculative activity, but not a collapse. In practice, it feels like Tron is in a holding pattern while the rest of the market processes macro fear.
Scenarios for Tron Crypto (TRXUSDT)
Bullish Scenario
The bullish case from here is a classic mean‑reversion from compressed volatility.
1. What bulls want to see:
– Daily closes back above $0.29, reclaiming the 50‑ and 200‑day EMAs.
– RSI on H1 and M15 lifting from oversold into neutral, confirming that the intraday selling phase is done.
– A widening of Bollinger bands with price riding the upper half rather than the lower.
If TRX can base above $0.28 and break through $0.29 with a convincing expansion in volume and range, there is room for a squeeze higher as shorts cover and sidelined capital chases the move. In that environment, short‑term targets would be prior local highs above $0.30 and then the next liquidity pockets; the exact levels would depend on how quickly volatility returns.
What invalidates the bullish case?
A sustained break and daily close below $0.28 with RSI on the daily slipping decisively under 45 and the 20‑EMA curling down would undercut the bull thesis. That would signal that this is not just a sideways pause but the start of a more meaningful down‑leg.
Bearish Scenario
The bearish case leans on the risk‑off macro backdrop and the intraday weakness.
1. What bears want to see:
– Persistent trading below $0.28 on H1, with the 20‑ and 50‑hour EMAs turning into clear resistance.
– Daily RSI slipping from neutral into the low‑40s, showing that selling is starting to dominate beyond just intraday noise.
– MACD on the daily rolling away from the flatline into negative territory, indicating that downside momentum is finally building.
If those conditions align, TRX can transition from a quiet range into a controlled downtrend. In that scenario, the Bollinger lower band around $0.27 becomes the first test. A clean break below it opens the door to revisiting prior swing lows further down.
What invalidates the bearish case?
A strong push back above $0.29 that holds on a daily closing basis, with intraday EMAs flipping to support and hourly RSI stabilizing near 50–60, would tell you bears have lost control. That would convert this from a potential breakdown into a failed breakdown or bear trap.
Positioning, Risk, and Uncertainty
This is not a trending environment for Tron right now; it is a low‑volatility standoff inside a fearful broader market. That combination is dangerous for over‑confident traders. Breakouts can come suddenly, and mean‑reversion strategies can get run over when the range finally gives way.
Key points to keep in mind:
– Volatility is compressed. ATR and Bollinger bands are telling the same story. Expect larger moves ahead relative to the recent past.
– Direction is unclear on the daily. The higher timeframe is neutral, while lower timeframes lean mildly bearish. There is a genuine tug‑of‑war between trend continuation and mean reversion.
– Macro sentiment is fragile. Extreme Fear and high BTC dominance mean the bar for positive surprise is high, but also that any sudden shift in risk appetite can trigger outsized moves in alts like TRX.
In practice, this is a spot where sizing, patience, and clear invalidation levels matter more than trying to predict the next candle. TRX is coiling, and whichever side of this $0.28–$0.29 band eventually breaks is likely to set the tone for the next significant leg in Tron crypto’s trend.


You May Also Like

USDC Exchange Inflows Hit $350M—Traders Buying The Bitcoin Dip?

Brent Crude Remains Sensitive to Iran Headlines After Pullback, Says Danske Bank


