

Why Solana Price Struggles Despite $1.66B RWA Growth Surge
This article was first published on The Bit Journal.
Despite strong on-chain growth and record real-world asset activity, the Solana price continues to trade under pressure. Traders are confronted with a market in which fundamentals seem good, but technical signals and derivatives data continue to signal further downside risk.
Solana-based real-world asset (RWA) ecosystem grew by around $1.66B in its tokenized equivalent recently. This is a significant achievement for the blockchain’s endeavors in on-chain finance and settlement.
Solana Price Struggles Despite Strong Network Growth
Meanwhile, record spot ETF inflows, strong network activity and solid DeFi revenue suggest that network usage remains healthy. But price action has not kept up with these bullish signs, underscoring a pronounced divergence between fundamentals and investors’ mood.
Analysts say the overall trend is still distinctly bearish. Price in a sideways range on higher time frames as the market still trades within a long-term descending channel on higher time frames.
However, institutional demand and capital inflows into tokenized products on Solana have not dulled. Risk is off in the markets, but not risk will be in today’s trading environment. Against this backdrop, the Solana price lacks evidence of sustainability on any meaningful recovery rallies.
Real-World Assets Expand on Solana
The RWA ecosystem on Solana has grown to a historic high of $1.66 billion in tokenized value. This growth reflects a steady migration of capital on-chain and rising institutional participation in Solana’s settlement infrastructure.
These flows underline confidence in the network’s technology and its role in tokenizing real-world instruments. Even so, the surge in RWAs has not stopped persistent downside pressure in the market.
Derivatives Data Flash Bearish Signal
In the derivatives market, positioning leans clearly bearish. Solana’s long-to-short ratio stands at 0.89, near its lowest level in over a month, according to CoinGlass data. A reading below 1 shows that more traders are betting on further price declines.
The funding rate for perpetual futures flipped negative on Saturday and sits near -0.0245% on Monday. This level is close to the funding environment seen during the February 6 sell-off, signaling that short sellers are willing to pay to maintain their positions.
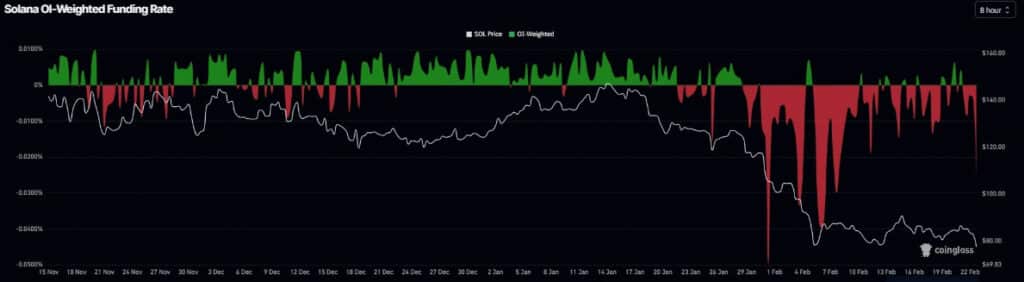 Source: CoinGlass
Technical Indicators Point to Further Downside
On the daily chart, Solana has slipped about 6%, trading near the lower edge of its consolidation range around $76.45 on Monday. A firm daily close below this zone would confirm a breakdown and could open the path toward the February 6 low near $67.50.
Zooming out, the long-term descending channel on the weekly chart remains intact. There are also notable price imbalances up to the $140 region that could be revisited before a deeper southward extension level near $47.9 is tested as support.
Analyst Ali Martinez has pointed out that the monthly SuperTrend indicator has flipped to a sell signal, a pattern last seen in 2022 before a severe drawdown.
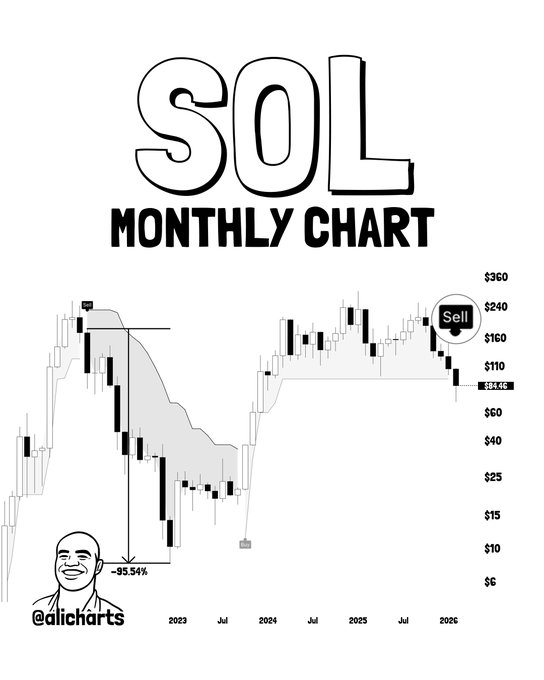 Source: X
RSI, MACD, and Momentum Signals
Daily chart’s RSI is now around 31. The indicator is currently pointing downwards towards the oversold region indicating with pressure bearish movement continues to fare, but momentum not yet drained.
The MACD lines are closing in, indicating lack of direction among traders. This configuration still does not have a formal bullish crossover in place. Instead, it suggests this is a fragile balance, one in which another bearish factor could easily push momentum back to the downside for the Solana price.
Holder Behavior and Profitability Metrics
On-chain data shows that long-term holders started accumulating in January. The Hodler net position change turned positive, signaling increased positions among long-term participants.
| Month | Min. Price | Avg. Price | Max. Price | Change |
|---|---|---|---|---|
| Feb 2026 | $ 78.17 | $ 87.39 | $ 100.45 |
26.78%
|
| Mar 2026 | $ 99.52 | $ 116.83 | $ 129.34 |
63.24%
|
| Apr 2026 | $ 124.10 | $ 126.76 | $ 128.73 |
62.47%
|
| May 2026 | $ 114.39 | $ 120.28 | $ 125.13 |
57.93%
|
| Jun 2026 | $ 116.96 | $ 124.16 | $ 132.48 |
67.21%
|
| Jul 2026 | $ 104.10 | $ 111.81 | $ 117.00 |
47.66%
|
| Aug 2026 | $ 113.15 | $ 117.34 | $ 121.45 |
53.29%
|
| Sep 2026 | $ 114.19 | $ 116.00 | $ 122.71 |
54.87%
|
| Oct 2026 | $ 117.01 | $ 123.57 | $ 129.18 |
63.04%
|
| Nov 2026 | $ 117.68 | $ 120.41 | $ 123.89 |
56.37%
|
| Dec 2026 | $ 114.31 | $ 115.54 | $ 116.62 |
47.18%
|
However, this accumulation trend has weakened over the past three weeks. The slowdown coincided with the asset slipping below the $100 mark. The percentage of addresses in profit now hovers near 20%, a level not seen since November 2023.
During the previous bear cycle, this metric fell as low as about 1.37% in late December 2022. While past patterns do not guarantee a repeat, the low share of profitable addresses helps explain the cautious mood among holders.
Key Levels for Traders to Watch
Near term support rests at the lower end of the consolidation around $76.45. A close below here daily would expose a retest of the February 6 low ($67.50). A failure to hold there would strengthen the prevailing bearish trend.
Resistance: If buyers defend the support and push momentum back into their control, the next important level is around the upper consolidation boundary, at approximately $89.38. A shift into this area would suggest short-term revival, albeit within the broader decline.
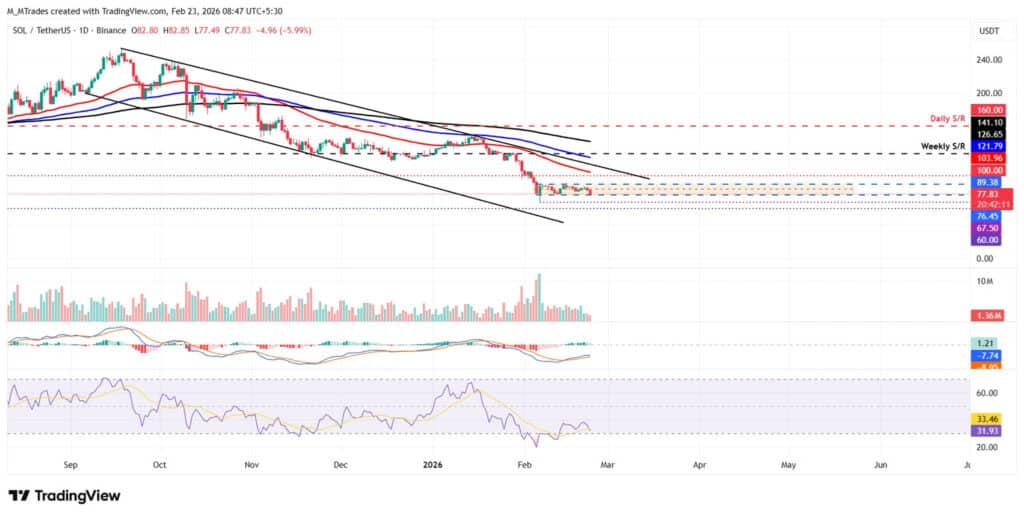 Source: TradingView
Conclusion
Solana fundamentals are strong: record RWA utilization, increasing institutional participation and dApp revenue. But the market structure remains stubbornly bearish, and technical indicators and derivatives data continue to tilt in the direction of further downside.
Long-term investors, on the other hand, continue to monitor the on-chain metrics and critical support zones when determining whether or not the risk-reward profile for Solana price looks more promising.
Appendix: Glossary of Key Terms
Real-World Assets (RWA): Legacy financial assets (such as bonds, real estate, etc.) that are tokenized and then issued on a blockchain.
Long-to-Short Ratio: A market sentiment indicator that is calculated by dividing the amount of traders’ long positions to short ones in derivatives trading.
Funding Rate: A periodic settlement paid between long and short traders of perpetual futures contracts based on overall market sentiment.
FALLING CHANNEL A bearish chart pattern created in a descending downward sloping parallelogram formed by successive lower highs and lower lows.
Relative Strength Index (RSI): A speed and breadth momentum indicator that ranges from 0 to 100 and measures the speed and change of price movements.
Frequently Asked Questions About Solana Price
1- What is driving the recent Solana price decline?
The decline is influenced by bearish derivatives positioning, negative funding rates, and technical resistance within a long-term descending channel.
2- How significant is Solana’s $1.66 billion RWA milestone?
It reflects growing institutional participation and expanding tokenized asset adoption on the network.
3- What are key support and resistance levels?
Support is near $76.45, while resistance stands around $89.38. A break below support could open the path toward $67.50.
4- Do technical indicators suggest a rebound?
Current RSI and MACD readings indicate bearish momentum and market indecision rather than confirmed reversal signals.
References
AMB Crypto
FXStreet
Read More: Why Solana Price Struggles Despite $1.66B RWA Growth Surge">Why Solana Price Struggles Despite $1.66B RWA Growth Surge


You May Also Like

USDC Exchange Inflows Hit $350M—Traders Buying The Bitcoin Dip?

Brent Crude Remains Sensitive to Iran Headlines After Pullback, Says Danske Bank


