

Solana Crypto News: SOL Tries to Stabilize Below $90 After a Steep Mean-Reversion Move

After an intense risk-off move across digital assets, the latest Solana crypto news focuses on SOL as it struggles to stabilize following a deep retracement.
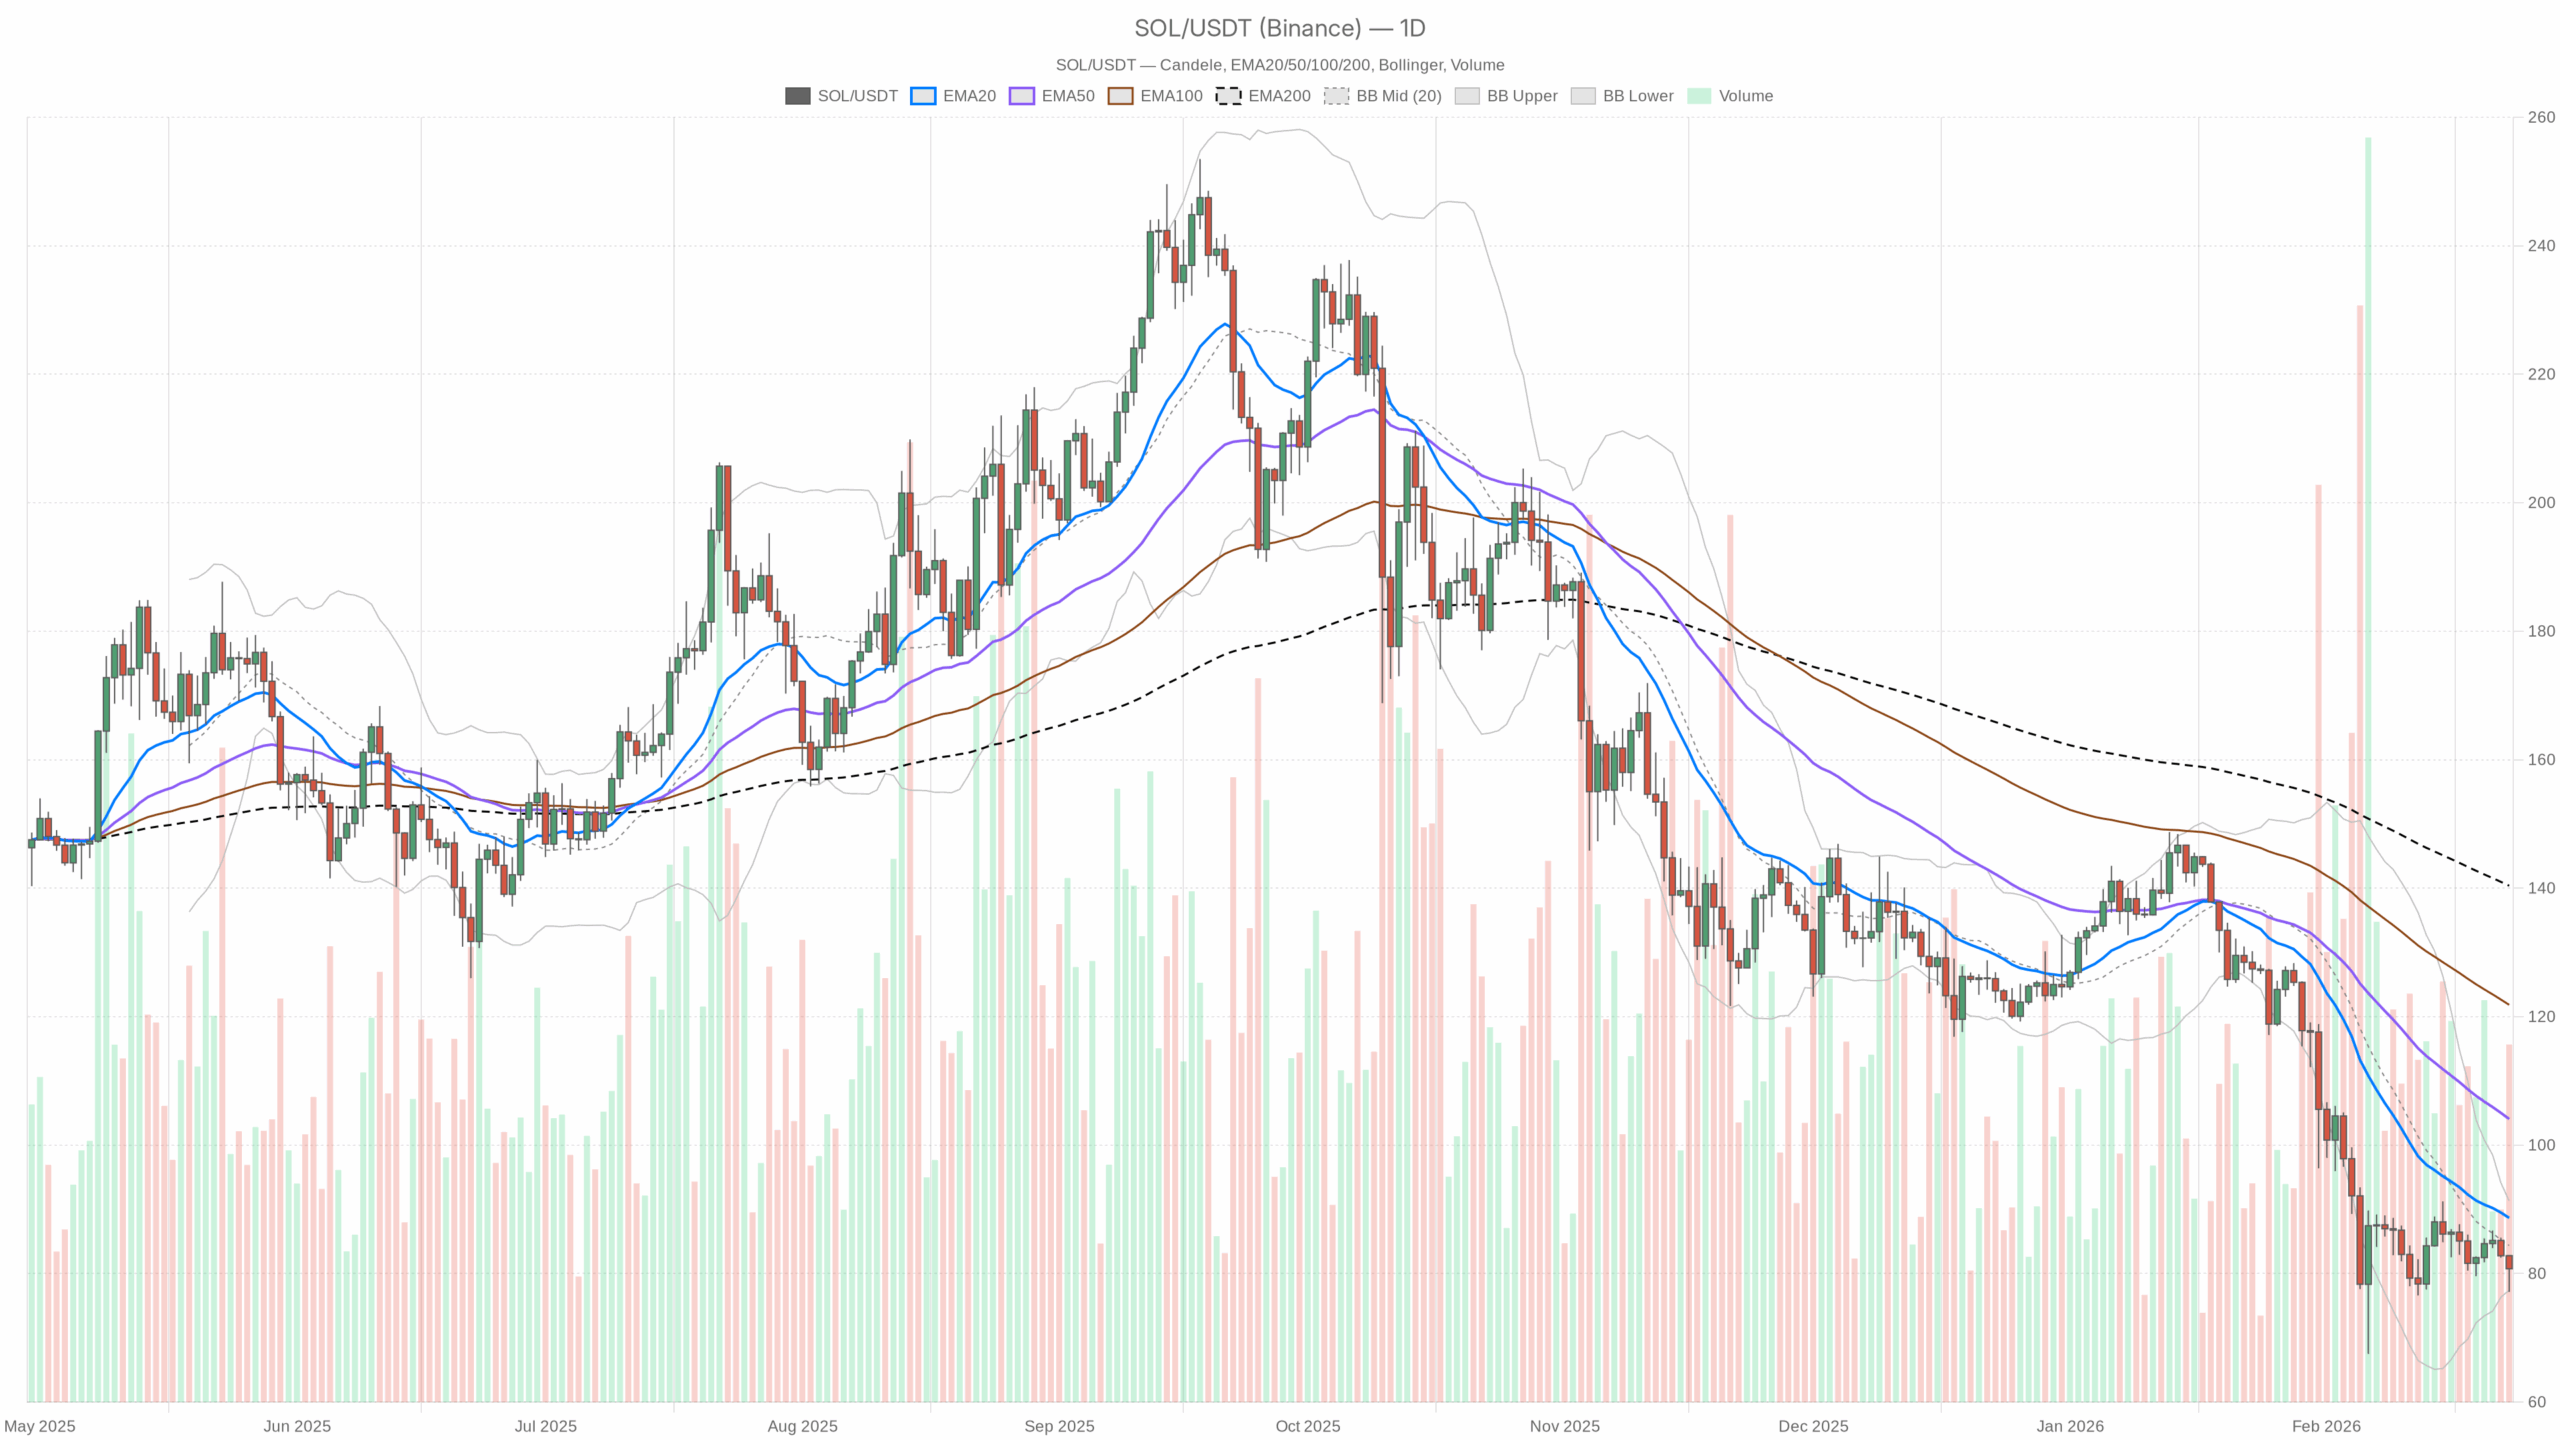 SOL/USDT — daily chart with candlesticks, EMA20/EMA50 and volume.
Crypto news: Solana Is in a Bearish Retracement, Not a Breakdown (Yet)
Solana (SOL) is trading around $80.7, firmly below the prior high area but trying to stabilize after a sharp pullback. On the daily chart the trend is clearly bearish in the short-to-medium term, yet the pace of the selloff has eased and intraday structure is starting to flatten out.
This is one of those classic mean-reversion phases inside a larger upcycle for the broader market: BTC dominance is elevated above 56%, total crypto market cap is down roughly 1.4% on the day, and sentiment is in Extreme Fear. Moreover, capital is defensive, liquidity is selective, but Solana’s on-chain ecosystem (Raydium, Orca, Meteora, etc.) is still generating meaningful fees. That mix often produces choppy, two-sided trading rather than a clean trend day.
Daily Chart (D1): Primary Bias – Bearish, But Not Collapsing
On the daily timeframe, the regime is flagged as bearish, and the price action backs that up.
Trend Structure: EMAs
Price vs EMAs: SOL closes at $80.76, below the 20-day EMA at $88.67, the 50-day EMA at $104.07, and the 200-day EMA at $140.39.
What it means: The market has decisively slipped below all key moving averages. This is not just a small pullback; it is a full reset lower in the trend structure. With the 20D and 50D far above spot, the path of least resistance on the daily remains down or sideways, not aggressively up. Any rally toward $88–$90 first, then $100–$105, should be treated as a test of resistance until proven otherwise.
Momentum: RSI
RSI 14 (Daily): 34.22.
What it means: Momentum is weak but not in a full-blown capitulation zone. We are sitting just above classical oversold territory. That often corresponds to a market that has already absorbed a big leg down but has not yet attracted aggressive dip-buyers. There is room for a further grind lower or a bounce – it is a fragile spot, not a clean reversal signal.
Momentum Confirmation: MACD
MACD line: -7.5, Signal: -8.9, Histogram: +1.4.
What it means: Both MACD and signal are negative, so the dominant momentum has been down. However, the histogram is ticking positive, meaning the downside momentum is losing intensity. Bears are still in control on the higher timeframe, but the selling pressure is no longer accelerating. This is typical before either a consolidation phase or a counter-trend bounce.
Volatility & Range: Bollinger Bands
Bollinger Bands (20D): Mid at $84.38, Upper at $91.32, Lower at $77.43. Current price is just above the lower band.
What it means: Trading so close to the lower band after a move down usually signals a mature leg of the selloff. The easy part of the downside is likely behind us. Price hugging the lower band without slicing through it suggests more of a bleed or base-building phase than immediate panic. Still, as long as SOL cannot reclaim the mid-band around $84–$85, the market is only stabilizing, not truly reversing.
Volatility: ATR
ATR 14 (Daily): $4.99.
What it means: Average daily swings near $5 on an $80 asset are significant but not extreme for Solana. Volatility is elevated enough that intraday traders can find opportunity, yet not so wild that we are in liquidation mode. Expect broad daily ranges in the $6–$10 band on outsized days, with $4–$5 as a more typical move.
Key Daily Levels: Pivot
Daily Pivot (PP): $80.25 | Resistance R1: $83.36 | Support S1: $77.66
What it means: Price is trading almost exactly on the daily pivot. This is a balance point: the market is undecided intraday within a broader downtrend. A sustained push above $83–$84 would indicate buyers starting to lean back in; a break below $77–$78 would signal the next leg of the correction opening up.
1-Hour Chart (H1): Intraday Trying to Base Inside a Bearish Daily Context
The 1H timeframe shows a neutral regime, which is important: lower timeframes are no longer trending down strongly, they are starting to trade sideways.
Trend Structure: EMAs (1H)
Price vs EMAs: Close at $80.73 versus EMA20 $80.63, EMA50 $82.12, EMA200 $83.43.
What it means: On the hourly chart, SOL is hovering right around the short-term average and still below the 50 and 200 EMAs. Short-term participants are trying to push price back above immediate value, but they have not reclaimed the more meaningful intraday trend lines. This is classic early-stage basing – constructive, but not yet a trend reversal.
Momentum: RSI (1H)
RSI 14 (1H): 47.38.
What it means: Momentum is mid-range on the hourly. Neither buyers nor sellers have a strong edge intraday. After a prior downmove, this kind of RSI typically matches a consolidation where traders are reassessing positioning before the next impulse.
Momentum: MACD (1H)
MACD line: -0.82, Signal: -1.15, Histogram: +0.34.
What it means: Momentum is still technically negative (both lines below zero), but the histogram turning positive shows short-term bullish divergence on the intraday chart. Selling pressure is fading; early buyers are probing, but we do not yet have a decisive intraday uptrend.
Bollinger Bands & ATR (1H)
BB mid: $80.32, Upper: $84.38, Lower: $76.25. ATR 14 (1H): $1.09.
What it means: Price is riding near the middle to upper half of the 1H band structure while volatility sits around $1 per hour. Intraday, that is enough room for meaningful scalps but nothing like a blowout. The wide band between $76 and $84 reflects the recent volatility burst, but current positioning around the mid-band leans more toward range trading than immediate breakout.
Hourly Pivot
PP: $80.68 | R1: $80.86 | S1: $80.55
What it means: Price is pinned on the hourly pivot. Very short-term battles are being fought in a tight band. A clean hold above $80.9–$81 with increasing volume would favour a test of higher intraday resistance zones, while a slip back below $80.5 would likely drag SOL back toward the lower half of today’s range.
15-Min Chart (M15): Execution Layer, Mild Short-Term Bid
The 15-minute chart is neutral with a slight bullish tilt.
Trend Structure: EMAs (15m)
Price vs EMAs: Close at $80.74 versus EMA20 $80.27, EMA50 $80.13, EMA200 $82.23.
What it means: On the execution timeframe, price is above the short and medium EMAs but still below the 200 EMA. Short-term traders are in control on the upside, but this is within the context of a still-bearish bigger picture. This usually aligns with a counter-trend bounce rather than the start of a major leg higher.
Momentum: RSI & MACD (15m)
RSI 14 (15m): 60.52.
What it means: Short-term momentum is positive but not overbought. There is a modest intraday bid; short sellers are not pressing aggressively at this exact spot.
MACD line: 0.37, Signal: 0.35, Histogram: +0.02.
What it means: MACD is slightly positive and nearly flat. Buyers have the upper hand on the smallest timeframe, but the signal lacks strength. This favours continuation of a slow grind higher or sideways until a new catalyst appears.
Bollinger Bands, ATR & Pivot (15m)
BB mid: $80.36, Upper: $81.13, Lower: $79.59. ATR 14 (15m): $0.38.
What it means: On a 15-minute basis, typical bars are moving around $0.4. The current price near the mid-to-upper band supports the idea of a controlled intraday bounce. As long as SOL holds above $79.5–$80, short-term dip buyers are likely to stay active.
PP: $80.68 | R1: $80.87 | S1: $80.56.
What it means: Micro-structure is compressed around the same pivot cluster as the hourly chart. This is exactly what you see when the market is waiting for direction, not when it is in a trend expansion. In this context, the current Solana crypto news backdrop only reinforces the idea of patience and tactical timing.
Bullish Scenario for SOLUSDT
On the bigger picture, the market is still in a pullback, but short-term charts are hinting at a possible relief phase.
Core idea: Bulls are trying to turn an oversold, fearful environment into a tradable bounce.
What bulls need to see:
- Daily reclaim of the mid-Bollinger band near $84–$85, turning that region from resistance back into support.
- RSI (D1) lifting back above 45–50, confirming that downside momentum has fully cooled and buyers are stepping in with conviction.
- MACD (D1) histogram staying positive and lines curling upward, indicating a genuine shift from deceleration of the downtrend into early upside momentum.
- On H1 and M15, price holding above the cluster around $80–$81 and flipping the EMA50/200 on 1H ($82–$83.5) into support.
Upside targets in a bullish case: First, a push into the $88–$90 pocket (daily EMA20 and upper part of the recent range). If the broader market stabilizes and fear eases, a stretch move toward the $100–$105 zone (near the daily EMA50) comes into play as a more ambitious mean-reversion target.
What invalidates the bullish scenario: A clean daily close back below $77–$78 (under S1 and near the lower band) with RSI breaking under 30 and MACD rolling back down would signal that the selloff has another leg to run. That would put the bounce idea on hold and keep SOL in a classic sell the rip mode.
Bearish Scenario for SOLUSDT
The daily trend and macro sentiment still favour caution. In this environment, rallies can be used to re-establish short exposure or de-risk long positions.
Core idea: The move so far is a pause in a broader downswing, not a durable bottom.
What bears are watching:
- Failure to reclaim $84–$85 and repeated rejections near the daily mid-band or the 1H and 4H EMAs.
- Daily RSI stalling in the low- to mid-40s and rolling back toward 30, confirming that bounces are being sold.
- MACD (D1) staying below zero and the histogram flipping back negative after this brief easing of downside momentum.
- On intraday charts, price slipping back below $80 and then $77–$78, turning the current balance area into a failed base.
Downside targets in a bearish case: A decisive break under $77–$78 opens room toward the lower volatility projections from ATR, with incremental supports every $4–$5 lower, in line with the current ATR. Market conditions and order book depth will determine whether those levels hold or we see a more linear flush.
What invalidates the bearish scenario: A sustained daily close back above $90 – ideally coupled with daily RSI reclaiming 50+ and the MACD curve turning upward – would tell you the corrective phase is likely over for now. In that case, dips toward $84–$86 would start to look more like buying opportunities than short entries.
Positioning, Risk, and How to Read This Tape
This is a two-speed market for Solana:
- The daily trend is still down, with price well below key EMAs and sentiment in Extreme Fear. That favours respecting risk, not heroically calling a bottom.
- The intraday picture is stabilizing. H1 and M15 show early signs of a base with fading downside momentum and modest short-term buying interest.
For traders, this usually argues for shorter holding periods and clear invalidation levels. Chasing either direction in the middle of the current $78–$85 band is likely to be punished by chop; the better opportunities typically come at the extremes of this range or after a confirmed breakout.
Volatility is high enough that position sizing matters. With daily ATR near $5, a move equivalent to 5–7% in either direction can happen without any macro news. Anyone trading around this zone needs to anchor decisions to levels, not emotions, and accept that uncertainty is still elevated until the daily structure either reclaims $90+ or breaks cleanly below $77.
In short, Solana is under pressure on the higher timeframe but not broken. Until daily momentum truly flips, every bounce is suspect, yet every new low also carries the risk of a sharp mean-reversion snapback. Traders can approach this as a range inside a downtrend and let the daily chart reveal when that story changes.


You May Also Like

Securitize Expands Tokenized Assets to TRON Network

Bitcoin World Reveals Top 5 Stunning Gainers And Losers


