

Kaspa Has No Bottom Yet: Here’s How Low KAS Price Can Go
KASPA No Signs Of A Bottom was the clear message at the start of the latest Crypto MindSet video. The analyst opened with a blunt view. Kaspa is still going lower. There are no confirmed signs of a bottom yet. That tone set the stage for a deep technical breakdown of KAS price and what could happen next.
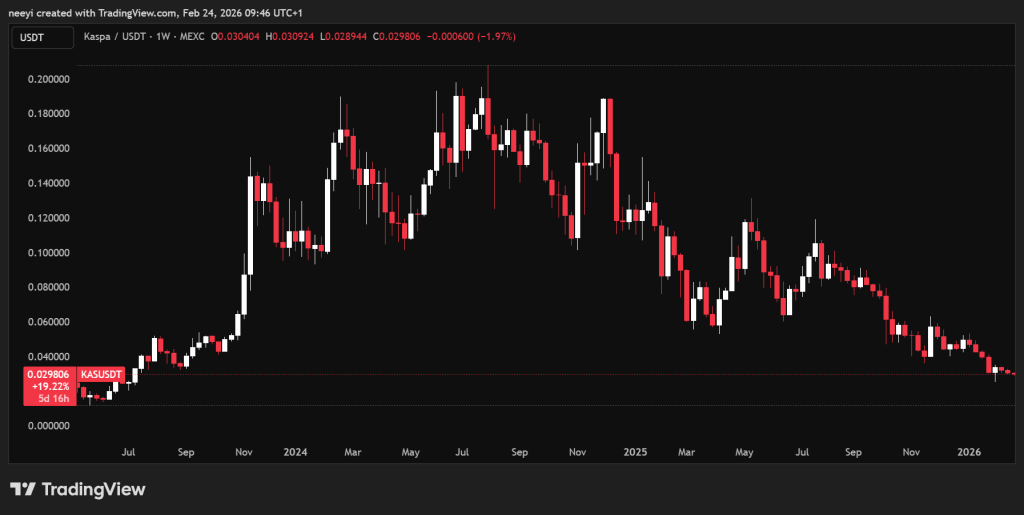
Alex from Crypto MindSet did not soften his words. He argued that the December 2024 top marked a decisive trend reversal for Kaspa. Heavy sell volume on the weekly chart, he explained, signaled the beginning of a prolonged bear phase. Since that moment, KAS price has remained under pressure.
Alex pointed to the weekly volume bars on the Kaspa chart. Red bars have dominated since the breakdown in December 2024. Green spikes appeared occasionally, yet they failed to change the broader structure. Price action, in his view, remains the primary guide. Once support levels broke on the weekly timeframe, the trend turned bearish.
 KAS Price Chart
He emphasized that volume confirms what price already shows. During the prior bull phase, green volume bars expanded as KAS price climbed. That dynamic has reversed. Red volume has controlled most weeks, which reinforces the idea that sellers still dominate the market.
Kaspa investors who expected immediate recovery after the top have faced persistent downside. The chart structure has not yet printed higher highs or higher lows on the weekly timeframe. Without that change, Alex sees no technical confirmation of a durable bottom.
Key Kaspa Price Levels At $0.01 And $0.005 Remain In Focus
The analysis moved into specific levels that could act as major support zones for KAS price. Using the Visible Range Volume Profile, Alex identified the point of control near $0.005. That area represents one of the largest historical accumulation zones on the chart.
He also discussed $0.01 as a significant psychological and structural level. If KAS price continues to decline, $0.015 and $0.01 stand out as potential reaction zones. A deeper retracement toward $0.005 cannot be ruled out, especially if broader crypto market conditions weaken.
Bitcoin plays a critical role in this outlook. Alex noted that if Bitcoin falls from the $60000 to $70000 range toward $20000, altcoins such as Kaspa could face additional pressure. KAS price historically moves in line with broader crypto trends, particularly during risk off phases.
The 50-Week Moving Average Defines The Real Kaspa Bottom Signal
A central part of the video focused on the 50-week moving average. Kaspa price remains below this level, and the average itself slopes downward. That configuration, Alex explained, signals that the broader trend remains bearish.
He described a typical cycle pattern. First, the 50-week moving average trends down. Later, it flattens. Eventually, it turns upward. The most favorable technical entry, in his framework, occurs when price reclaims the 50-week moving average after it begins to slope upward.
Until that happens, he considers any aggressive accumulation premature. Catching falling knives in a strong downtrend carries elevated risk. Waiting for structural confirmation, he argued, improves the probability of success.
Alex divided the bear market into two phases. The first phase involves sharp declines and strong selling pressure. The second phase features a prolonged bottoming structure with sideways to slow downward action.
Read Also: Pi Network Posts Record Growth Metrics, So Why Does the Pi Coin Chart Look Dead?
He speculated that the declining phase for Kaspa began in December 2024 and may extend into mid 2026. A potential stabilization period could emerge later in the year. A broader bull cycle, if it materializes, may not begin until 2027.
That timeline remains speculative. No one has a crystal ball. Markets evolve based on liquidity, macro conditions, and sentiment across Bitcoin and the wider crypto sector.
Kaspa remains one of the more closely watched altcoins in this cycle. KAS price now sits at a crossroads between deeper downside risk and the long wait for structural recovery. Whether $0.01 or even $0.005 becomes the eventual bottom remains uncertain.
Subscribe to our YouTube channel for daily crypto updates, market insights, and expert analysis.
The post Kaspa Has No Bottom Yet: Here’s How Low KAS Price Can Go appeared first on CaptainAltcoin.


You May Also Like

ONDO Flows to Binance, Coinbase Raise Concerns

Bitcoin dips to $70.6K, oil rises after US announces Hormuz blockade


