HBAR price faces downside riskHBAR price faces downside risk

HBAR price risks correction to $0.07 as intraday structure turns bearish

2026/02/24 23:53
4 min read

HBAR price faces downside risk after losing key support at $0.09, with bearish intraday structure increasing the probability of a corrective move toward $0.07.

Summary
  • $0.09 support flipped into resistance confirms bearish structure
  • Loss of point of control could accelerate downside momentum
  • $0.07 high-timeframe support becomes next downside target

Hedera (HBAR) price action is showing early signs of structural weakness following a decisive loss of high-timeframe support near the $0.09 level. What previously acted as a strong demand zone has now transitioned into resistance, marking an important shift in market structure.

This transition is technically significant. When former support flips into resistance, it often signals a change in market control from buyers to sellers. Recent price movements suggest that HBAR is now undergoing a bearish retest of this level, a common market behavior that frequently precedes continuation to the downside.

As long as HBAR trades below $0.09, the broader technical outlook favors further corrective movement, with the next major support region located near $0.07 coming into focus.

HBAR price key technical points

  • $0.09 support flipped into resistance: Structural breakdown confirms bearish shift
  • Point of control under threat: Loss of key volume support could accelerate downside momentum
  • $0.07 high-timeframe support targeted: Next major demand zone within current range
HBAR price risks correction to $0.07 as intraday structure turns bearish - 1

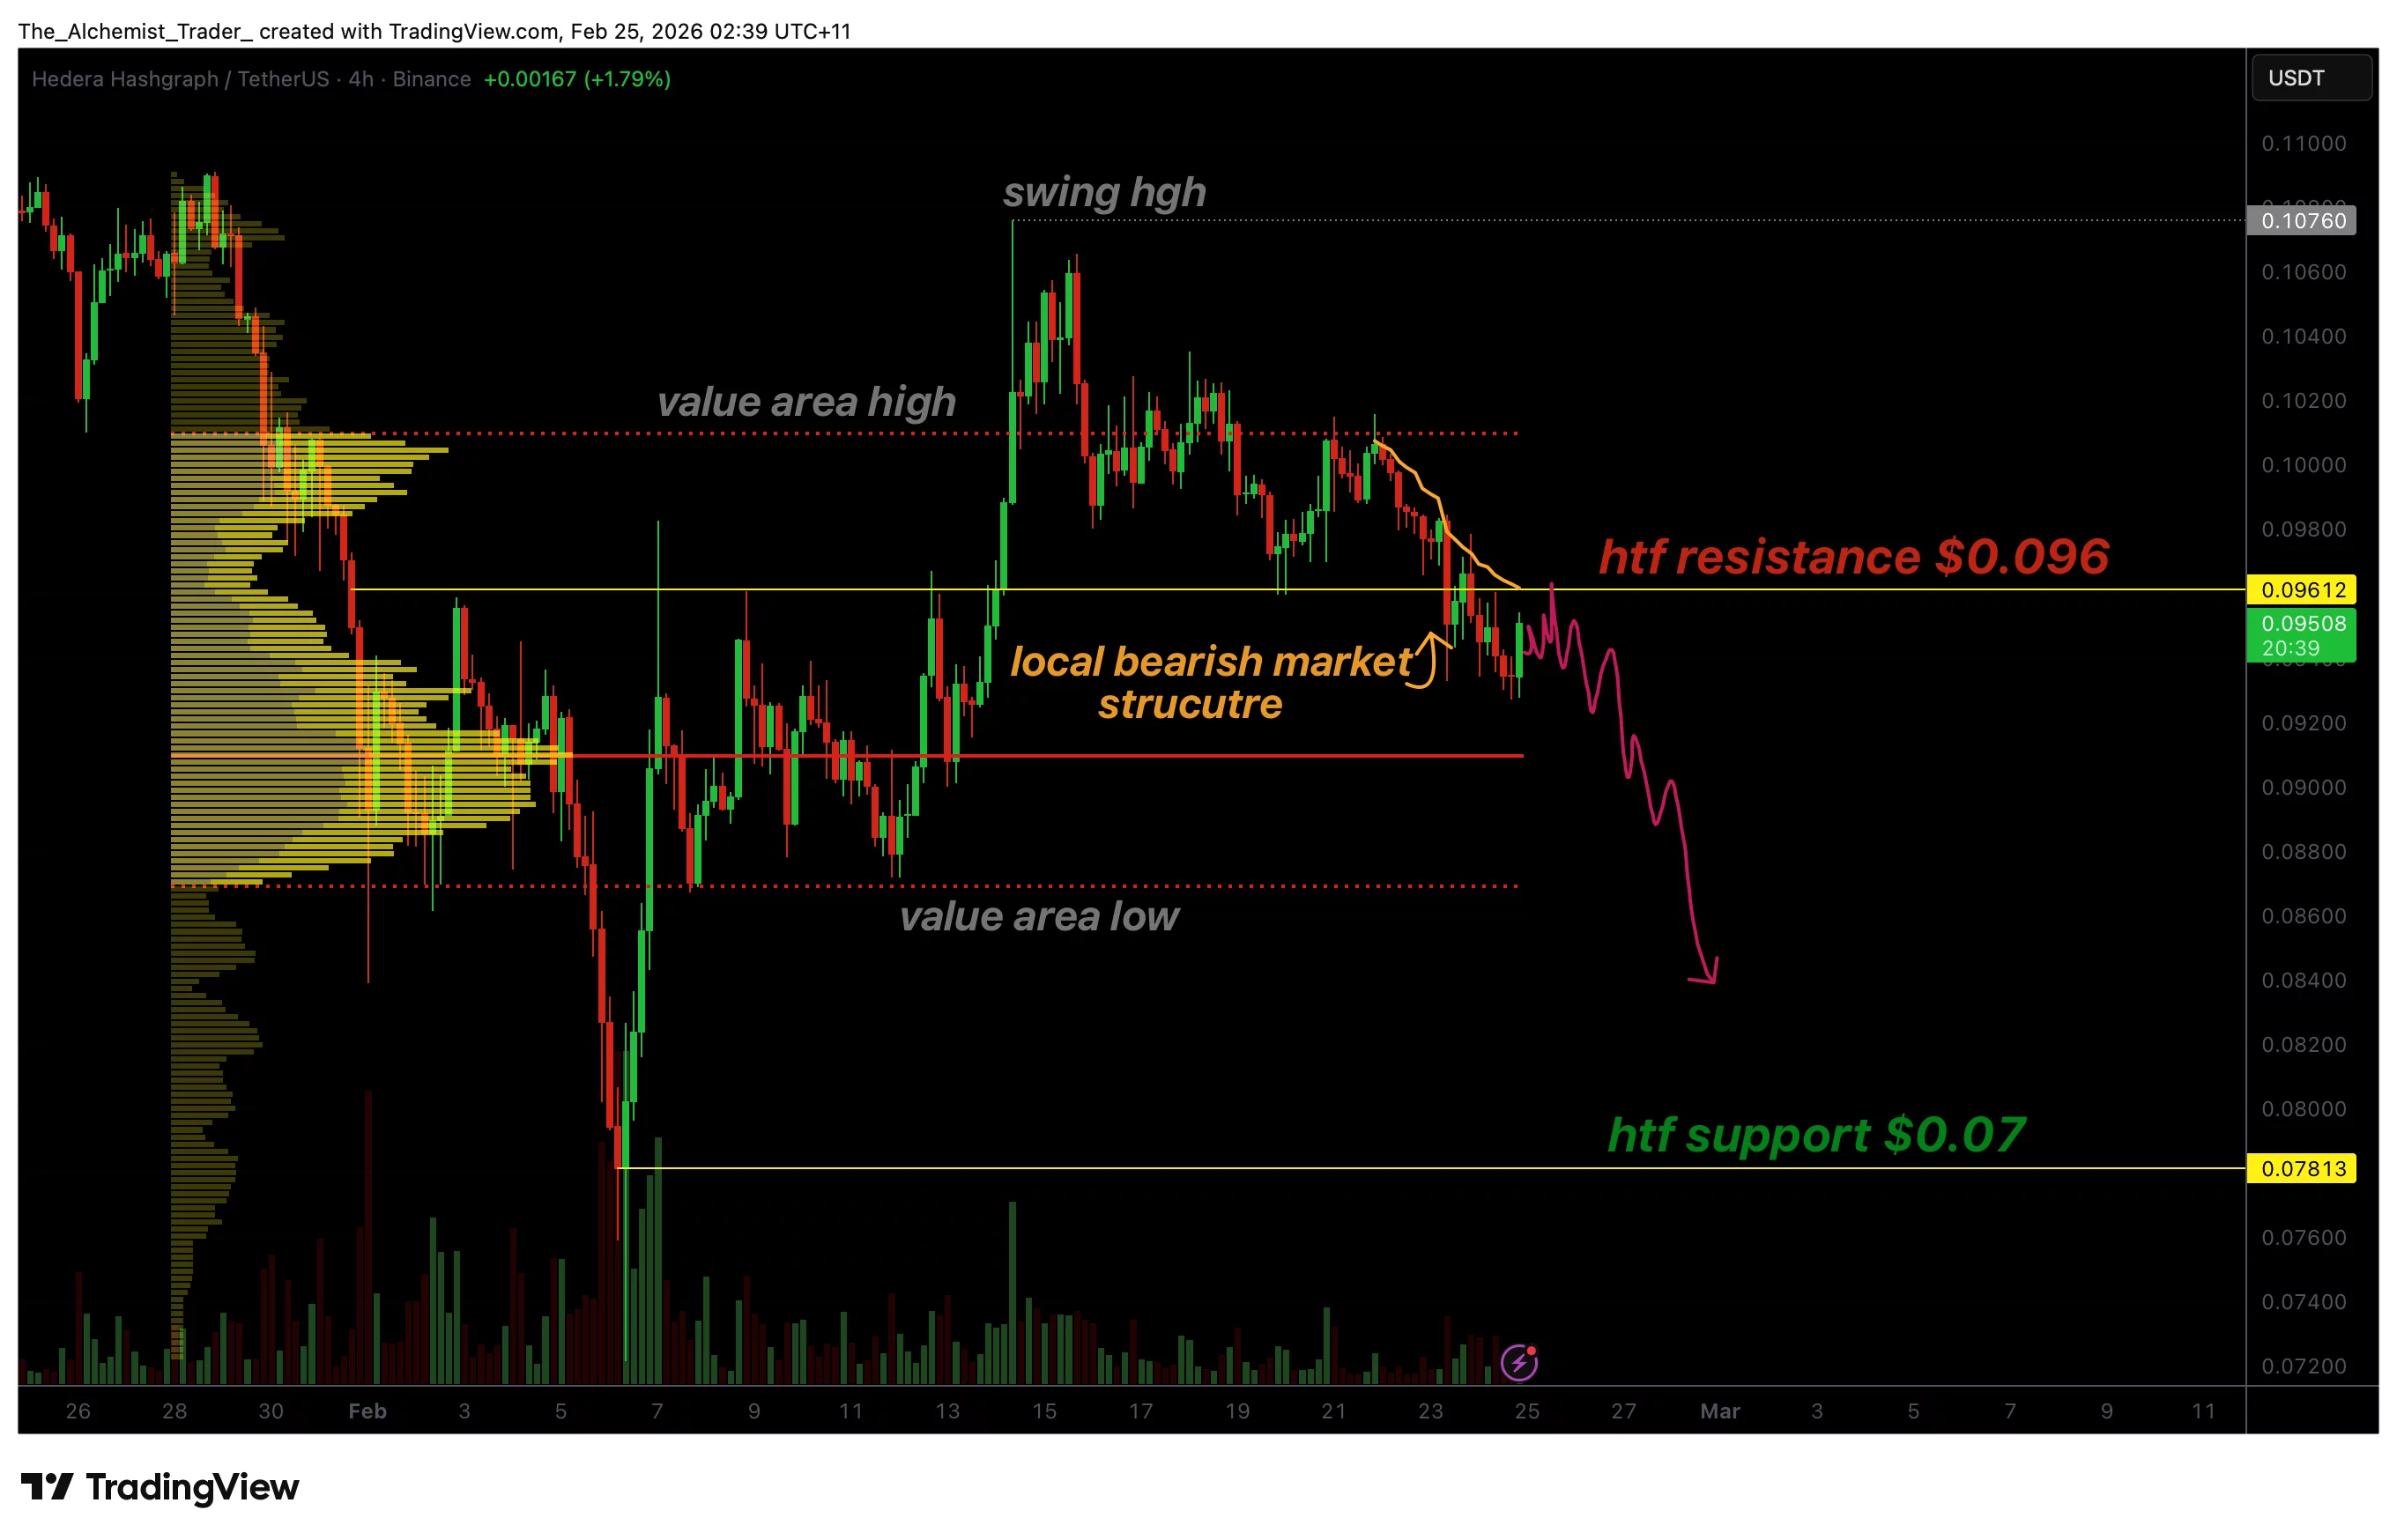
HBAR’s recent price action has been technically constructive in defining market direction. The confirmed loss of the $0.09 level represents a major structural development. Markets often respect these transitions strongly, as participants who previously bought at support may begin selling when price retests the level from below.

The current bounce toward resistance appears corrective rather than impulsive. Instead of establishing higher highs, price is forming a potential lower high within the intraday structure. This behavior aligns with a bearish retest scenario, where temporary upward movement allows sellers to re-enter positions before continuation lower.

From a market structure perspective, maintaining acceptance below $0.09 keeps sellers firmly in control. Until this level is reclaimed, bullish continuation remains unlikely in the short term.

Point of control becomes critical volume support

Another important level to monitor is the point of control (POC), which represents the area of highest traded volume within the broader range. The POC often acts as a final area of equilibrium before price transitions into expansion.

If HBAR loses acceptance around this level, it would signal that the market has abandoned its last major volume-based support. This development could significantly increase downside momentum.Below the POC lies a region of relatively thin volume, meaning fewer historical transactions exist to slow price movement. When markets enter low-volume zones, price tends to move quickly as liquidity gaps allow accelerated rotations toward lower value areas.

This technical dynamic strengthens the probability of a move toward the value area low and ultimately the $0.07 high-timeframe support.

Bearish retest suggests lower high formation

From a price action standpoint, the current local bounce appears to be a bearish retest rather than a trend reversal. Intraday structure continues to favor lower highs and weakening momentum, suggesting that the market is preparing for another rotational move downward.

Bearish retests typically occur after structural breakdowns, allowing price to revisit former support levels before sellers resume control. HBAR’s inability to reclaim resistance supports this interpretation.

If price forms a confirmed lower high beneath $0.09, it would further validate the bearish continuation thesis. This setup increases the likelihood that HBAR rotates toward deeper support levels as part of a broader corrective phase.

What to expect in the coming price action

From a technical, price action, and market structure perspective, HBAR remains vulnerable while trading below the $0.09 resistance. The current rebound appears corrective within a bearish intraday trend. A loss of the point of control could trigger accelerated downside movement toward the $0.07 high-timeframe support.

Unless buyers reclaim higher value and invalidate the lower-high structure, the probability favors continued downside rotation in the near term.

Market Opportunity
Hedera Logo
Hedera Price(HBAR)
$0.09556
$0.09556$0.09556
+0.32%
USD
Hedera (HBAR) Live Price Chart
Disclaimer: The articles reposted on this site are sourced from public platforms and are provided for informational purposes only. They do not necessarily reflect the views of MEXC. All rights remain with the original authors. If you believe any content infringes on third-party rights, please contact [email protected] for removal. MEXC makes no guarantees regarding the accuracy, completeness, or timeliness of the content and is not responsible for any actions taken based on the information provided. The content does not constitute financial, legal, or other professional advice, nor should it be considered a recommendation or endorsement by MEXC.
Tags:

You May Also Like

Source7 and Oyster Data Announce Strategic Partnership to Advance Property Asset Intelligence and Data Infrastructure

Source7 and Oyster Data Announce Strategic Partnership to Advance Property Asset Intelligence and Data Infrastructure

LOUISVILLE, Ky.–(BUSINESS WIRE)–Source7, a leading provider of home appliance and systems asset intelligence, today announced a strategic data infrastructure partnership
Share
AI Journal2026/02/25 03:16
US SEC approves options tied to Grayscale Digital Large Cap Fund and Cboe Bitcoin US ETF Index

US SEC approves options tied to Grayscale Digital Large Cap Fund and Cboe Bitcoin US ETF Index

PANews reported on September 18th that the U.S. Securities and Exchange Commission (SEC) announced that, in addition to approving universal listing standards for commodity-based trust units , the SEC has also approved the listing and trading of the Grayscale Digital Large Cap Fund, which holds spot digital assets based on the CoinDesk 5 index. The SEC also approved the listing and trading of PM-settled options on the Cboe Bitcoin US ETF Index and the Mini-Cboe Bitcoin US ETF Index, with expiration dates including third Fridays, non-standard expiration dates, and quarterly index expiration dates.
Share
PANews2025/09/18 07:18
Unprecedented Surge: Gold Price Hits Astounding New Record High

Unprecedented Surge: Gold Price Hits Astounding New Record High

BitcoinWorld Unprecedented Surge: Gold Price Hits Astounding New Record High While the world often buzzes with the latest movements in Bitcoin and altcoins, a traditional asset has quietly but powerfully commanded attention: gold. This week, the gold price has once again made headlines, touching an astounding new record high of $3,704 per ounce. This significant milestone reminds investors, both traditional and those deep in the crypto space, of gold’s enduring appeal as a store of value and a hedge against uncertainty. What’s Driving the Record Gold Price Surge? The recent ascent of the gold price to unprecedented levels is not a random event. Several powerful macroeconomic forces are converging, creating a perfect storm for the precious metal. Geopolitical Tensions: Escalating conflicts and global instability often drive investors towards safe-haven assets. Gold, with its long history of retaining value during crises, becomes a preferred choice. Inflation Concerns: Persistent inflation in major economies erodes the purchasing power of fiat currencies. Consequently, investors seek assets like gold that historically maintain their value against rising prices. Central Bank Policies: Many central banks globally are accumulating gold at a significant pace. This institutional demand provides a strong underlying support for the gold price. Furthermore, expectations around interest rate cuts in the future also make non-yielding assets like gold more attractive. These factors collectively paint a picture of a cautious market, where investors are looking for stability amidst a turbulent economic landscape. Understanding Gold’s Appeal in Today’s Market For centuries, gold has held a unique position in the financial world. Its latest record-breaking performance reinforces its status as a critical component of a diversified portfolio. Gold offers a tangible asset that is not subject to the same digital vulnerabilities or regulatory shifts that can impact cryptocurrencies. While digital assets offer exciting growth potential, gold provides a foundational stability that appeals to a broad spectrum of investors. Moreover, the finite supply of gold, much like Bitcoin’s capped supply, contributes to its perceived value. The current market environment, characterized by economic uncertainty and fluctuating currency values, only amplifies gold’s intrinsic benefits. It serves as a reliable hedge when other asset classes, including stocks and sometimes even crypto, face downward pressure. How Does This Record Gold Price Impact Investors? A soaring gold price naturally raises questions for investors. For those who already hold gold, this represents a significant validation of their investment strategy. For others, it might spark renewed interest in this ancient asset. Benefits for Investors: Portfolio Diversification: Gold often moves independently of other asset classes, offering crucial diversification benefits. Wealth Preservation: It acts as a robust store of value, protecting wealth against inflation and economic downturns. Liquidity: Gold markets are highly liquid, allowing for relatively easy buying and selling. Challenges and Considerations: Opportunity Cost: Investing in gold means capital is not allocated to potentially higher-growth assets like equities or certain cryptocurrencies. Volatility: While often seen as stable, gold prices can still experience significant fluctuations, as evidenced by its rapid ascent. Considering the current financial climate, understanding gold’s role can help refine your overall investment approach. Looking Ahead: The Future of the Gold Price What does the future hold for the gold price? While no one can predict market movements with absolute certainty, current trends and expert analyses offer some insights. Continued geopolitical instability and persistent inflationary pressures could sustain demand for gold. Furthermore, if global central banks continue their gold acquisition spree, this could provide a floor for prices. However, a significant easing of inflation or a de-escalation of global conflicts might reduce some of the immediate upward pressure. Investors should remain vigilant, observing global economic indicators and geopolitical developments closely. The ongoing dialogue between traditional finance and the emerging digital asset space also plays a role. As more investors become comfortable with both gold and cryptocurrencies, a nuanced understanding of how these assets complement each other will be crucial for navigating future market cycles. The recent surge in the gold price to a new record high of $3,704 per ounce underscores its enduring significance in the global financial landscape. It serves as a powerful reminder of gold’s role as a safe haven asset, a hedge against inflation, and a vital component for portfolio diversification. While digital assets continue to innovate and capture headlines, gold’s consistent performance during times of uncertainty highlights its timeless value. Whether you are a seasoned investor or new to the market, understanding the drivers behind gold’s ascent is crucial for making informed financial decisions in an ever-evolving world. Frequently Asked Questions (FAQs) Q1: What does a record-high gold price signify for the broader economy? A record-high gold price often indicates underlying economic uncertainty, inflation concerns, and geopolitical instability. Investors tend to flock to gold as a safe haven when they lose confidence in traditional currencies or other asset classes. Q2: How does gold compare to cryptocurrencies as a safe-haven asset? Both gold and some cryptocurrencies (like Bitcoin) are often considered safe havens. Gold has a centuries-long history of retaining value during crises, offering tangibility. Cryptocurrencies, while newer, offer decentralization and can be less susceptible to traditional financial system failures, but they also carry higher volatility and regulatory risks. Q3: Should I invest in gold now that its price is at a record high? Investing at a record high requires careful consideration. While the price might continue to climb due to ongoing market conditions, there’s also a risk of a correction. It’s crucial to assess your personal financial goals, risk tolerance, and consider diversifying your portfolio rather than putting all your capital into a single asset. Q4: What are the main factors that influence the gold price? The gold price is primarily influenced by global economic uncertainty, inflation rates, interest rate policies by central banks, the strength of the U.S. dollar, and geopolitical tensions. Demand from jewelers and industrial uses also play a role, but investment and central bank demand are often the biggest drivers. Q5: Is gold still a good hedge against inflation? Historically, gold has proven to be an effective hedge against inflation. When the purchasing power of fiat currencies declines, gold tends to hold its value or even increase, making it an attractive asset for preserving wealth during inflationary periods. To learn more about the latest crypto market trends, explore our article on key developments shaping Bitcoin’s price action. This post Unprecedented Surge: Gold Price Hits Astounding New Record High first appeared on BitcoinWorld.
Share
Coinstats2025/09/18 02:30