

Is the US stock market overvalued? Key risks every investor should know
The S&P 500 has started 2026 at record highs. Forward earnings are rising, core inflation has cooled to 2.5% year over year, and the Federal Reserve has already cut rates to a 3.50-3.75% range.
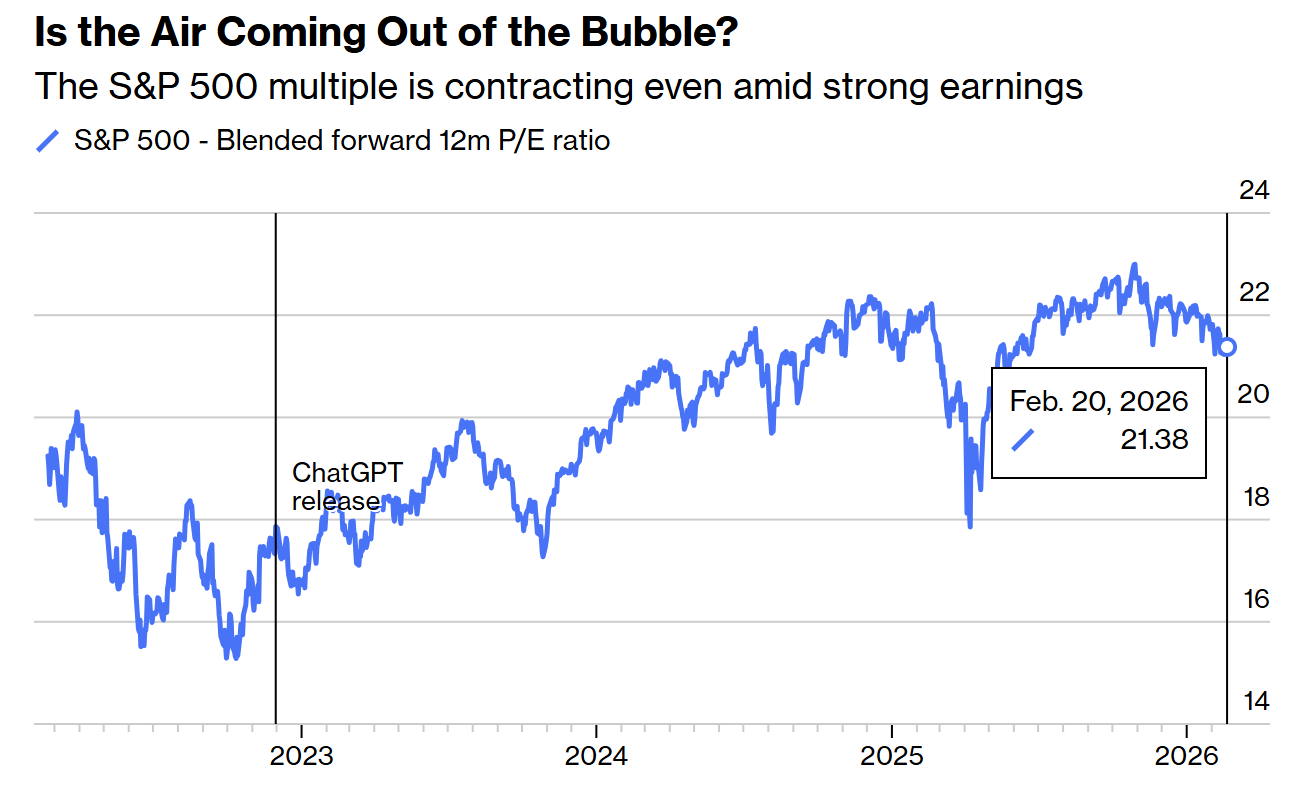
Meanwhile, the index trades at about 21.4 times forward earnings and well above its “pre-AI” average.
Naturally, investors are worrying about the threat of a correction, or even a market crash.
What they need to know is that the market is indeed strong, expensive and deeply tied to the economy itself.
The stock market now drives the economy
Earnings growth is what has always pulled stock prices higher. But today, the direction often runs the other way.
Higher equity prices are lifting household net worth, stronger wealth supports consumption, and consumption keeps GDP expanding.
The Federal Reserve’s balance sheet expanded to nearly $9 trillion in 2022, after years of quantitative easing. It now stands at $6.6 trillion.
Fiscal deficits remain close to 6% of GDP. Both policies have supported asset prices directly or indirectly. Since 1987, markets have come to expect liquidity when stress appears.
The so-called Fed put did not begin with Jerome Powell. It started under Alan Greenspan and survived through Ben Bernanke and the pandemic response in 2020.
When equity wealth becomes a primary engine of spending, a correction is no longer a market-only event. It feeds into hiring plans, corporate investment and consumer behaviour. That connection defines the current cycle.
Is the US market overvalued?
The S&P 500 trades at roughly 21.4 times blended forward earnings, down from around 23 times in late 2025, according to Bloomberg data.
Before OpenAI released ChatGPT in late 2022, the five-year average multiple was closer to 18.7 times.
 Source: Bloomberg
A return to that historical average would imply roughly 12-13% downside from current levels, even if earnings forecasts hold. That scenario would fall within historical norms.
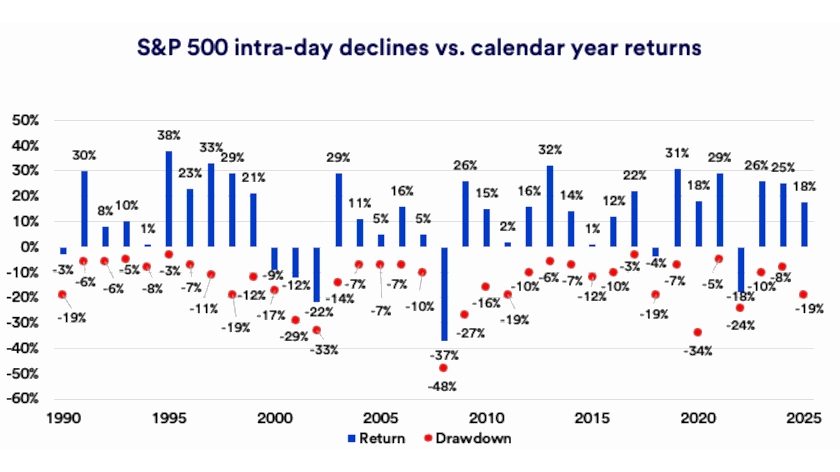
Research from US Bank shows that since 1990, the average intra-year drawdown for the S&P 500 has been about 14%.
The market has spent nearly 29% of the time since 1927, more than 10% below its recent highs.
 Source: U.S. Bank
Investors should not confuse a 10-15% reset with a systemic event.
A 20% decline or more usually requires an earnings recession, a credit event or an aggressive tightening cycle. None of those is visible in the current data.
The AI repricing is a healthy development
From late 2022 through 2025, the market multiple expanded almost mechanically as enthusiasm around artificial intelligence intensified.
Roughly every six months, the forward multiple added another full point. That pace was unlikely to continue without eventually creating instability.
In early 2026, the multiple has compressed even as earnings expectations remain firm and 10-year Treasury yields have stabilised or declined.
Software companies and other so-called middlemen have faced pressure as investors question whether AI tools can reduce their pricing power.
Large technology firms are committing massive capital expenditures to data centres and infrastructure, with Amazon, Microsoft, Alphabet, Meta and Oracle planning sizable increases in AI-related spending this year.
Investors are now asking whether those investments will translate into durable cash flow.
That change in psychology reduces the risk of a late 1990s style blow off. A gradual repricing of expectations is far less damaging than a sharp collapse after unchecked optimism.
Inflation and Fed remain the pivot
Core CPI has slowed to 2.5% year over year, down from over 3% in 2025, though still above the Federal Reserve’s 2% target.
The central bank has cut rates by 1% in late 2024 and another 0.75% through 2025. Officials project one additional 25 basis point cut in 2026, while markets are pricing two or three.
That gap is where volatility can emerge. If inflation reaccelerates toward 3% or higher, rate cuts would likely pause, and equity multiples could compress.
If disinflation continues and growth holds, financial conditions would ease further, and valuations could remain supported.
At present, bond yields have not surged, and recession indicators remain contained.
The macro backdrop does not resemble 2000, when valuations detached from profits, or 2008, when credit markets were deteriorating beneath the surface.
Breadth is improving, and concentration risk is easing
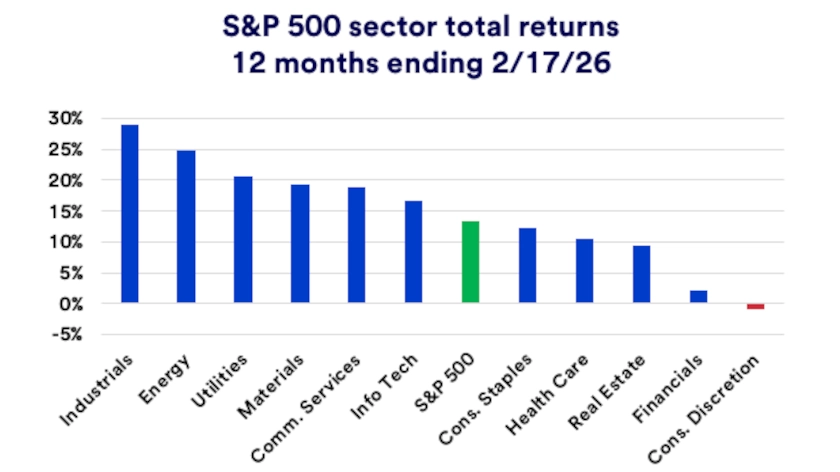
Eight of the eleven S&P 500 sectors have reached new highs in early 2026. Participation has broadened beyond mega-cap technology.
Mid-cap and small-cap stocks have improved, and international equities have shown better relative performance.
 Source: U.S. Bank
Broader participation reduces dependence on a single narrative. In 2023 and 2024, a handful of AI-linked giants carried a large share of index returns.
That concentration created fragility.
Today, the rally rests on more pillars, including consumer resilience and stable earnings growth.
Tariffs remain elevated near 12% on average imported goods compared with roughly 2% at the start of 2025, according to public estimates.
However, markets have largely absorbed this regime. Unless policy escalates again, trade does not appear to be the immediate catalyst for a breakdown.
What investors should actually focus on
The dominant risk in 2026 is not euphoria but dependency.
When asset prices support consumption and policy makers are seen as responsive to market stress, expectations build around continued stability.
A moderate correction is statistically likely this year.
A severe bear market would require either a clear earnings contraction, a sharp inflation surprise or widening credit spreads. Those conditions are not present in the current data.
The market is priced for competent execution from companies deploying AI capital, from central bankers managing inflation and from policy makers handling trade.
As long as profits grow and inflation drifts lower, equities can grind higher even from elevated valuations.
The more subtle question is how long an economy powered by rising asset prices can sustain itself without producing either excess leverage or renewed inflation pressure.
That tension, more than daily headlines, is what will define the next phase of this cycle.
The post Is the US stock market overvalued? Key risks every investor should know appeared first on Invezz


You May Also Like

What’s Next for BTC After Tanking to $66K?

China solar panel exports to Africa jump by 83% as demand for clean energy surges

Amazon (AMZN) Stock; Rises on $33B Southeast Asia AI and cloud push


