TLDR Solana (SOL) surged 10–13% in 24 hours, reaching an intraday high near $89 Bitcoin rebounding above $67K has fueled broader altcoin momentum US-traded spotTLDR Solana (SOL) surged 10–13% in 24 hours, reaching an intraday high near $89 Bitcoin rebounding above $67K has fueled broader altcoin momentum US-traded spot

Solana (SOL) Price: Why SOL Jumped 10% and What the Charts Say Now

2026/02/26 15:34
3 min read

TLDR

  • Solana (SOL) surged 10–13% in 24 hours, reaching an intraday high near $89
  • Bitcoin rebounding above $67K has fueled broader altcoin momentum
  • US-traded spot Bitcoin ETFs saw $258 million in net inflows on Feb. 24
  • Spot Solana ETFs recorded $40 million in net inflows since Feb. 9
  • Key resistance levels for SOL sit at $90, $95, and $100

Solana’s price jumped over 10% in 24 hours, climbing from a two-week low of $75 to an intraday high near $89. The move came as the broader crypto market recovered, pushing total market cap up to around $2.28–$2.38 trillion.
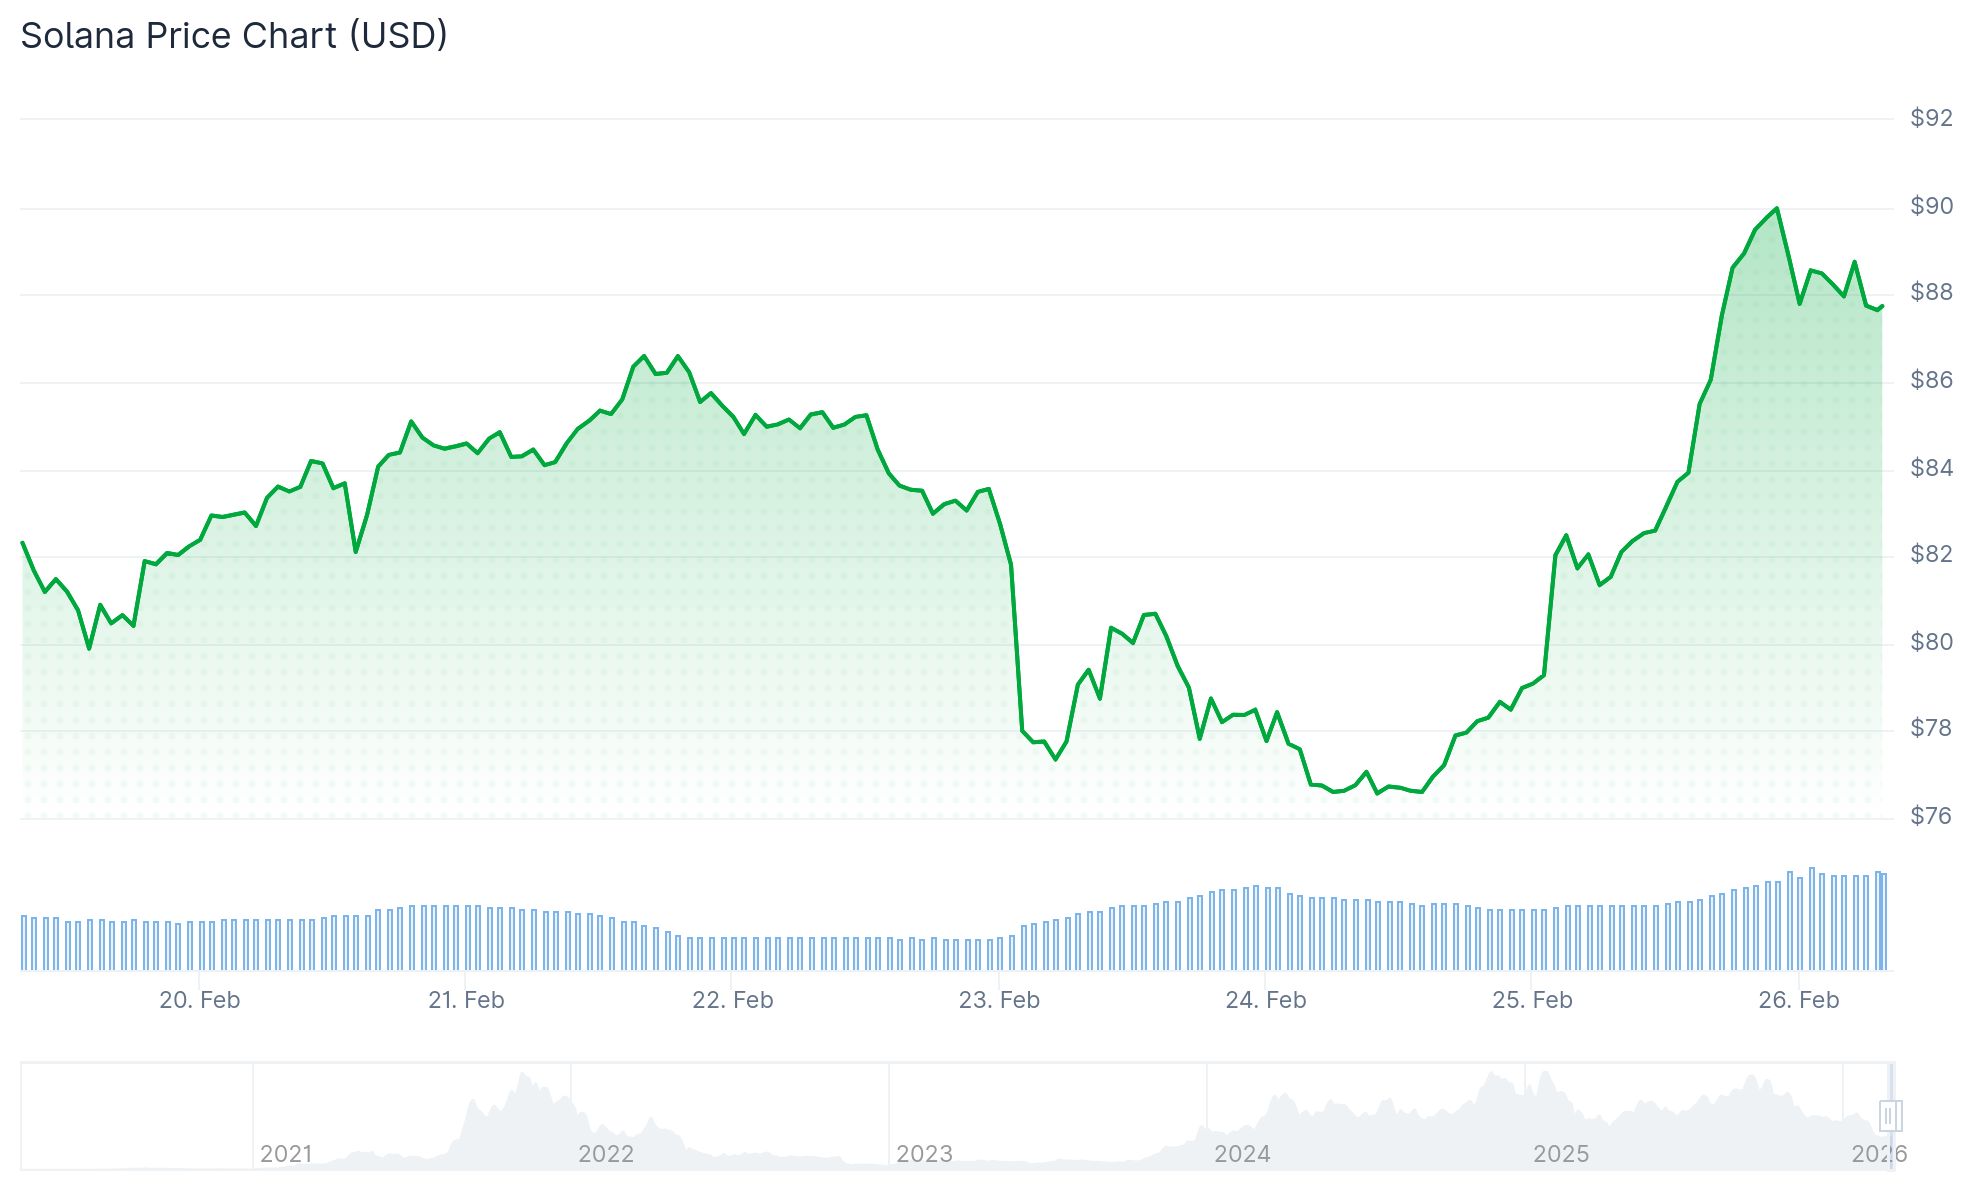
Solana (SOL) PriceSolana (SOL) Price

Bitcoin led the charge, rising more than 5% to trade around $66,800–$68,000. That recovery helped lift major altcoins across the board, with Ethereum up 8%, XRP up 6%, and Dogecoin also posting gains.

US-traded spot Bitcoin ETFs recorded $258 million in net inflows on February 24. Fidelity’s FBTC led with $82.8 million, pointing to renewed institutional buying.

Source: Farside Investors

Solana-specific demand also picked up. Spot Solana ETFs have pulled in $40 million in net inflows since February 9, adding to the buying pressure on SOL.

SOL’s open interest rose more than 5% to $5.27 billion alongside the price move. Short liquidations totaling $15.4 million were recorded over the same 24-hour period.

Technical Breakout in Play

On the six-hour chart, SOL broke above a symmetrical triangle pattern. The measured target from that breakout points to $110, which also lines up with the 50-day simple moving average.

For that move to hold, price needs to stay above the 100-day SMA at $86. A daily close above the 20-day EMA at $88 could open the path toward $95 and later $117, according to analysts.

Glassnode data shows limited historical buying activity above $85, meaning there are fewer holders sitting on losses in that zone. That could reduce overhead selling pressure in the near term.

The RSI was reading 72.84 at time of reporting, entering overbought territory. The MACD showed a bullish crossover with a histogram reading of around 1.20.

What Needs to Happen Next

Analysts say a sustained Bitcoin move above $72,000 could be the trigger for Solana’s next leg up toward $100.

Immediate resistance for Solana sits at $90, then $95, with $100 as the key psychological level. The next major resistance above that is around $115, where roughly 22 million SOL were previously acquired.

Macro events this week include jobless claims Thursday, the January Producer Price Index on Friday, and speeches from eleven Federal Reserve speakers.

At time of reporting, SOL was trading at $88.56, with a session high of $89.19 and a low of $85.98.

The post Solana (SOL) Price: Why SOL Jumped 10% and What the Charts Say Now appeared first on CoinCentral.

Market Opportunity
Solana Logo
Solana Price(SOL)
$87.87
$87.87$87.87
+2.23%
USD
Solana (SOL) Live Price Chart
Disclaimer: The articles reposted on this site are sourced from public platforms and are provided for informational purposes only. They do not necessarily reflect the views of MEXC. All rights remain with the original authors. If you believe any content infringes on third-party rights, please contact [email protected] for removal. MEXC makes no guarantees regarding the accuracy, completeness, or timeliness of the content and is not responsible for any actions taken based on the information provided. The content does not constitute financial, legal, or other professional advice, nor should it be considered a recommendation or endorsement by MEXC.

You May Also Like

Standard Chartered Predicts a $2 T Stablecoin Cap by 2028 as BTC Faces a Fair Value Gap 📊

Standard Chartered Predicts a $2 T Stablecoin Cap by 2028 as BTC Faces a Fair Value Gap 📊

👋 Welcome to the CoinStats Scoop, your weekly newsletter with the most groundbreaking Web3 innovations and market-moving headlines in the crypto space.Stay in the
Share
Coinstats2026/02/26 15:57
Surging Crypto Prices Spark Wide-Scale Liquidations

Surging Crypto Prices Spark Wide-Scale Liquidations

The post Surging Crypto Prices Spark Wide-Scale Liquidations appeared on BitcoinEthereumNews.com. In an unexpected rally, the cryptocurrency market saw substantial
Share
BitcoinEthereumNews2026/02/26 16:04
Cardano Price Will ‘Break the Internet’ to $20: Here is Why

Cardano Price Will ‘Break the Internet’ to $20: Here is Why

The post Cardano Price Will ‘Break the Internet’ to $20: Here is Why appeared on BitcoinEthereumNews.com. Key Insights: A 10x to 20x Cardano price rally aligns with both technical setup and historical growth cycles. The relative performance chart for ADA indicates that 2023 brought significant gains, and while 2024 saw some retracement, the broader trend remains intact. Cardano (ADA) market cap rose to $33.34 billion. Cardano price has been gaining strong momentum in recent weeks, with analysts pointing to a potential 10x–20x breakout. Backed by solid technical patterns, growing institutional exposure, and increasing network activity, ADA is positioning itself as one of the most promising altcoins in the current market cycle. Analyst Predicts Cardano Price Rally by 10X – 20X Cardano price shows strong signs of a major breakout on the 1-day chart as it consolidates within a long-term resistance trendline. Now, it is testing this level with higher lows, which often signals that buyers are gaining strength. Once ADA price breaks above this line, momentum could accelerate quickly. In addition, the price has held steady near the $0.90 region despite market volatility. This stability suggests strong support from long-term holders. If ADA pushes past the $1.20–$1.50 range, the next resistance zone sits much higher, leaving room for explosive upside, as per an analysis by Mr P Crypto. Cardano Price Analysis | Source: Mr P Crypto, X A Closer Look into ADA Price & Performance Furthermore, the relative performance chart indicates that 2023 brought significant gains, and while 2024 saw some retracement, the broader trend remains intact. With renewed demand and increasing development activity on the Cardano network, investors may soon see rapid appreciation. Therefore, if ADA follows the same pattern of previous bull runs, a move toward $10 or even $20 is not unrealistic. A 10x to 20x increase would align with both the technical setup and historical growth cycles. In short, Cardano price looks…
Share
BitcoinEthereumNews2025/09/19 16:13