

What the U.S. Iran Geneva Talks Mean for Brent and WTI Oil Prices
TLDR
- Oil prices edged up ~0.3% Thursday ahead of a third round of U.S.-Iran nuclear talks in Geneva
- ING analysts say a deal could remove up to $10/barrel in risk premium currently priced into oil
- U.S. crude inventories jumped 16 million barrels last week, the largest build in nearly three years
- OPEC+ is expected to agree to resume supply increases from April this weekend
- Kazakh oil exports and shrinking floating storage suggest the physical market is getting better supplied
Oil prices ticked up slightly on Thursday as traders positioned themselves ahead of a third round of nuclear talks between the United States and Iran. Brent crude rose 0.3% to around $71 a barrel, while WTI gained a similar amount to about $65.55.
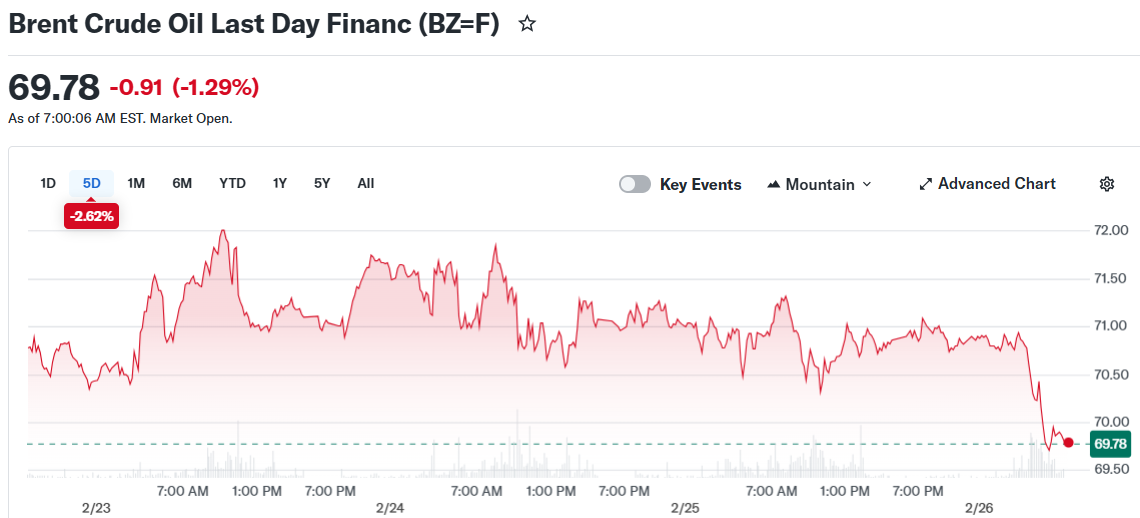 Brent Crude Oil Last Day Financ (BZ=F)
The talks are being held in Geneva. U.S. special envoy Steve Witkoff and Jared Kushner are scheduled to meet Iranian officials to discuss Tehran’s nuclear and ballistic missile programs.
Iranian Foreign Minister Abbas Araqchi said a diplomatic solution is still possible if both sides engage constructively. President Trump has warned that “bad things” could happen if meaningful progress is not made.
Trump gave Iran a 10-to-15-day ultimatum for a deal and continued to pressure Tehran during his State of the Union address. Analysts at Tradu noted that the U.S. military buildup in the Middle East keeps the risk of conflict on the table.
Iran is one of OPEC’s larger producers. Any disruption to its output, or to flows through the Strait of Hormuz, could push oil prices sharply higher.
ING analysts said that if talks go well, the market could gradually unwind as much as $10 per barrel in geopolitical risk premium they believe is currently priced in. If talks break down, the upside risk stays, but markets may wait to see how far the U.S. is willing to go before reacting fully.
A Well-Supplied Market Weighs on Prices
On the supply side, data from the U.S. Energy Information Administration added downward pressure. Commercial crude stocks rose by 16 million barrels in the week ending February 20. That was far above expectations and the largest weekly build since February 2023.
Gasoline inventories fell by about 1 million barrels during the same period. Distillate stocks rose modestly by around 250,000 barrels, while refinery runs declined.
Separately, price spreads between near-term and later Brent crude contracts have weakened. This is typically a sign that the physical oil market is becoming better supplied.
Kazakh oil exports through the Caspian Pipeline Consortium terminal are returning to normal after earlier disruptions. Floating storage is also shrinking, which analysts say suggests that previously sanctioned barrels are now finding buyers.
OPEC+ Supply Decision Looms
OPEC+ is expected to meet this weekend. ING analysts believe the group will agree to resume supply increases starting in April.
If that happens alongside a U.S.-Iran de-escalation, analysts say weaker market fundamentals would likely feed through to a lower flat price for oil. The combination of rising inventories, returning supply, and a potential Iran deal gives the market several reasons to price lower.
The Geneva talks were scheduled for later Thursday, February 26.
The post What the U.S. Iran Geneva Talks Mean for Brent and WTI Oil Prices appeared first on CoinCentral.


You May Also Like

New Zealand Retail Sales Rise 0.9% in Q1, Topping Market Expectations

BoJ’s Koeda: Monetary Policy Is the Right Tool to Tackle Inflation

They’re called ‘super pollutants’ — and Trump’s EPA wants to expose you to more of them


