

Data reveals the first three minutes of OM’s collapse: Who pulled the “death trigger”?
Author: ltrd
Compiled by: Tim, PANews
OM (Mantra) plunged nearly 95% in a single day amid a series of highly unusual and highly publicized market events. I collected as much information as possible and looked through the relevant data. In the following article analysis, I will gradually sort out the possible reasons behind this plunge.
I will explain:
- Why was OKX not the source of this sell-off (even though that was the initial allegation I heard)?
- Why are some people selling OM tokens like it’s the end of the world?
- Why might a wallet that started staking OM 448 days ago be directly related to this incident?
In the first part, we will focus on market microstructure and how to properly analyze such events. Afterwards, I will outline how the whole situation may have unfolded and which actors may have played a key role in it.
It must be made clear that:
- This sell-off is anything but "normal," even in the cryptocurrency market.
- The scale and chaos of this move has, in my opinion, pushed several market participants to the brink of liquidation, which is clearly visible in both the order book data and the fund flows.
- Again, this is only my personal version of events. These are not official allegations, and you are not expected to take anything stated here as the absolute truth.
No one knows for sure what happened, except perhaps a few insiders.
I hope you will read my content with a critical eye. If you find any inconsistencies in my logic or analysis, please point them out. I share this with good intentions to show how to approach complex trading events. And of course, because I enjoy doing it.
A quick look at the OM crash
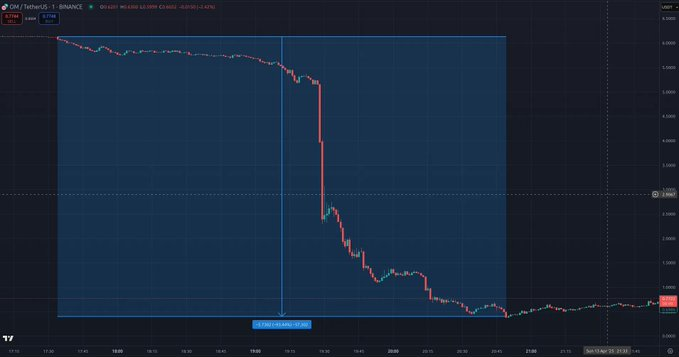
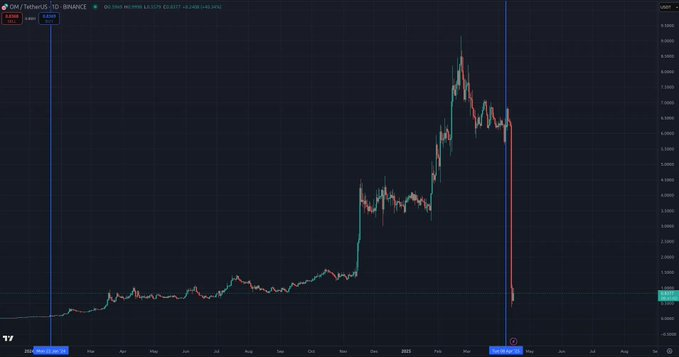
Around 19:30 (UTC) on April 14, the OM token suffered a massive sell-off. The token has been listed on almost all major exchanges, including the perpetual contract market. It should be noted that the existence of its perpetual contract market is an important detail.
Before the crash, OM was ranked in the top 25 cryptocurrencies by market capitalization. However, within a few hours, its price plummeted by about 95%, including a drop of nearly 90% in just one hour.
Such fluctuations are shocking even for low-market-cap altcoins ranked outside the top 2,000, let alone the top 25.
Market Microstructure: Finding the Origins of the Selloff
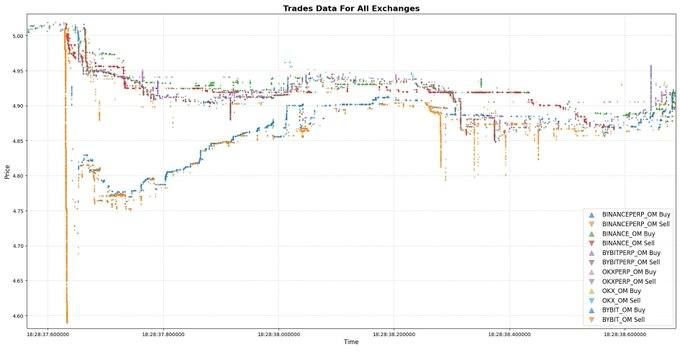
We will focus on the critical few minutes during which the crash occurred. Next, I will analyze a three-minute period, which I have divided into three parts for greater clarity.
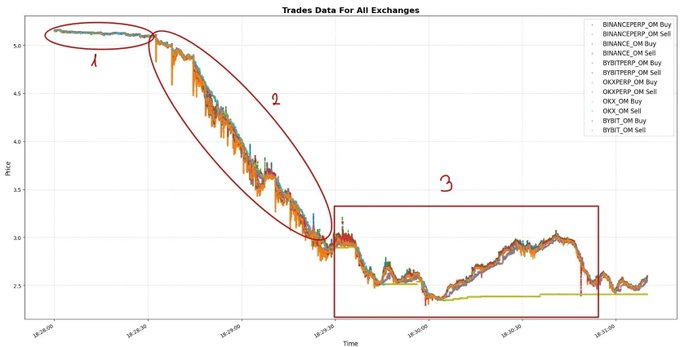
In the first phase, there was a slight but noticeable selling pressure in the market. This pressure was mainly concentrated in the perpetual contract markets of Binance and Bybit, as these platforms provide traders with the most convenient short-selling channels.
Remember: you don’t need to hold the current currency to create selling pressure. Perpetual contracts are actually a better option for large-scale directional investments due to their high liquidity and leverage characteristics.
The second step is the most critical because it determines the significance of the entire event. Let us analyze it carefully.
First, from a macro perspective:
Although Binance Perpetual Contracts has the deepest liquidity in the market, its market impact (i.e. the magnitude of price fluctuations caused by a single market order) is far greater than any other exchange.
This phenomenon conveys key information:
The main funds behind this round of sell-offs are mainly active in the Binance perpetual contract market.
Why is this so? There are two possible reasons:
- Each round of price fluctuations is initiated by Binance Perpetual Contracts. In fact, the platform always leads the market trend (more details will be released later);
- Even with the support of deep liquidity, huge market orders still caused violent price fluctuations, leaving other market participants with no time to react or cancel their orders.
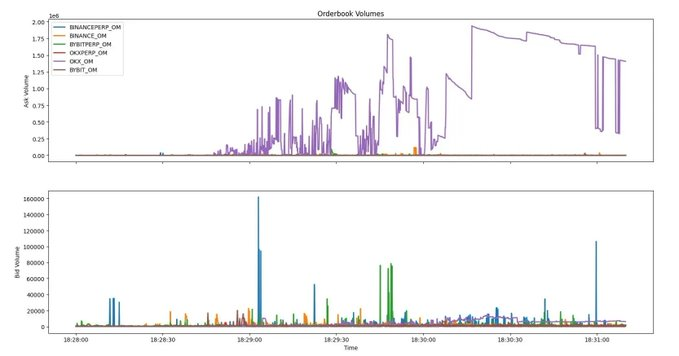
Here is the evidence at the micro data level:
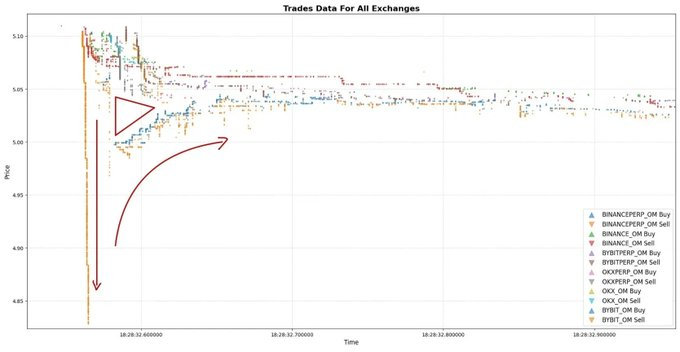
This is a classic case in the field of high-frequency trading. A trader has the ability to short sell on a large scale relative to market liquidity. We observed that in a specific time period (18:29:00, 18:29:10, 18:29:15), there were transactions of about $1 million every 5 seconds. This high-frequency trading behavior clearly reflects the characteristics of institutional-level high-frequency trading strategies.
OK, here’s what’s happening: a well-funded market participant is shorting OM tokens like the end of the world is nigh. Obviously, every market sell order will cause a huge market shock (~5% volatility), but this shock is only temporary, just the immediate price impact at the moment of the transaction.
The market will then return to a short-term price equilibrium state. This process will form a liquidity gap between exchanges (in a triangular shape), that is, the transaction price of a certain trading platform is significantly lower than the market fair price.
This is why in the Binance perpetual futures market, most of the capital flow after each large market order is actually just the market re-finding equilibrium or transmitting price signals to other exchanges.
Even though there is strong selling pressure in the market, there is only one real driver: someone is manipulating every tiny fluctuation (not so tiny) of OM on Binance Perpetual Contracts.
We see a lot of this happening. As you can see, the pattern is pretty much the same: Binance Perpetual moves first, and then other exchanges follow.
We will experience large instantaneous market shocks, followed by liquidity gaps and ultimately a short-term equilibrium.
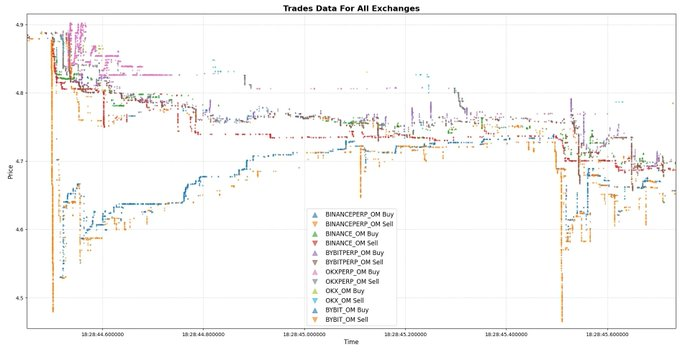
Once again, the same pattern occurs. I hope you enjoy these types of charts as much as I do, because honestly, every time I see something like this, it makes me emotional. This is pure art.
Following a series of similar incidents, nearly 4 million OM tokens were shorted in a completely unprofessional, dirty and chaotic manner. This attack was clearly well-planned because of its speed, brutality and complete disregard for cost.
But then, things started to get weird.
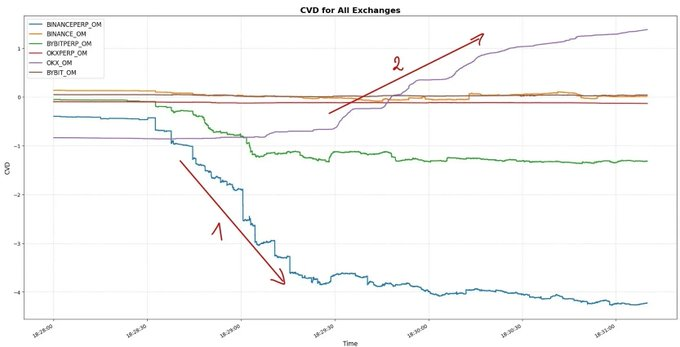
As you can see on our Cumulative Volume Difference (CVD) screen, the OM token open interest difference on Binance Perpetual is -4 million, while on OKX (after Binance price bottomed out) the CVD continues to climb.
Unfortunately, this is when the exchange data starts to mislead. Not only you, but many very smart analysts are also misled.
This is exactly what I said on Twitter today, it is extremely difficult to draw clear conclusions from trading data. The data is almost always incomplete. You have no idea who the market participants are or what their intentions are. You are only seeing the surface, and your analysis is to get as close to the truth as possible.
Right now, I can tell you with certainty that in the next 120 seconds, a certain OKX user will launch an unprecedented frenzy of selling, the intensity of which may exceed your cognitive boundaries.
Fasten your seat belts, things are about to get even more exciting!
Let's take a look at the third part of the initial plot.
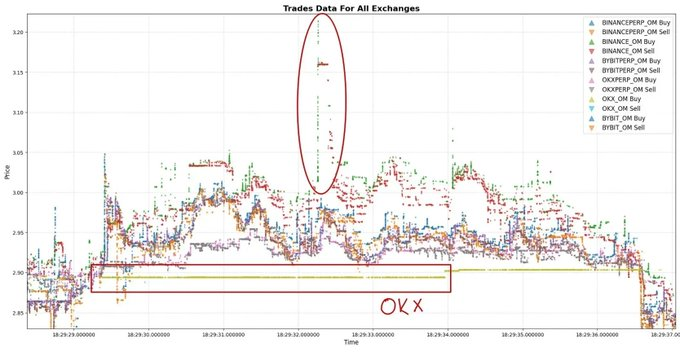
One minute after the OM sell-off began, the price had plummeted 50% from the starting point, and at this moment, someone suddenly appeared out of nowhere. Let’s call him “OKX OM-Whale” for now.
The whale began placing market sell limit orders a few percentage points below the top of the order book. Suddenly, the transaction price on the OKX exchange was much lower than that on other platforms.
You already know why, right? There’s a huge limit sell order sitting there: millions of OM tokens waiting to be sold.
This is why CVD is positive, not because the market is buying crazily, but because one participant is selling heavily, while other participants take the opportunity to make arbitrage operations. They buy in the OKX spot market and short in the perpetual contract market or other spot platforms to hedge.
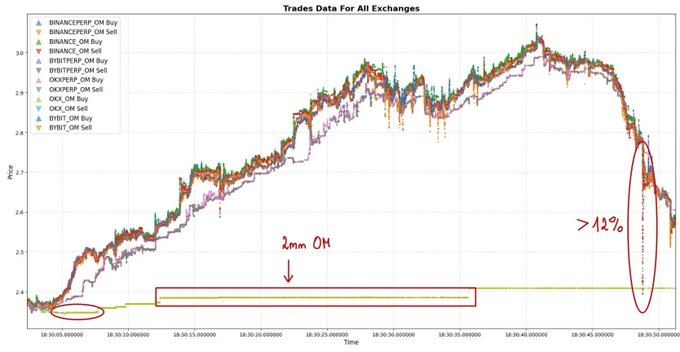
There was even a single limit order for 2 million OM on the OKX exchange that held the price still for a full minute. And that’s the only reason you’re seeing positive activity in CVD.
This is not because people are buying frantically, but because some (most likely only one) market participant is selling all the assets they can.
You can view the order volume for the top 10 tiers of each exchange’s order book here.
Notice all the outliers?
Yes, the selling side is always OKX.
There are only two possibilities left:
- Either this market participant is forced to sell (or they are in serious trouble)
- Either he is fully aware of the market trend and realizes that now is the time to sell out.
These executable limit orders do not look like they were pre-planned or executed by an algorithm.
This feels like a hasty decision made within a minute of the sell-off starting, and the people who made it had no other choice.
What is the second possibility?
They knew all about OM. When they saw the sell-off of that magnitude, they immediately realized that the crash had begun and rushed to get out while they could.
"But how could something like this happen?"
There are some speculations circulating on the X platform. One of the most interesting claims is that the OM project team allegedly encouraged some trading companies to provide them with USDT loans using OM tokens as collateral.
How does this statement fit into the "death spiral" script?
Imagine doing something like this:
- Pledge OM as collateral and you borrow USDT
- Deposit USDT to Binance
- Roughly shorting OM through perpetual contracts. This method is not very clever, but it relies on the overwhelming position size to smash the market, causing market collapse and chaos, triggering a chain of liquidations
- This eventually led to the currency price being halved.
This script totally holds up.
Am I telling you the truth? No. We don't have any hard evidence, just scattered clues and patterned behavior.
The OM whales on the OKX platform may be:
- A user who is forced to sell due to loan terms or risk control red lines
- Participants in this hunt
- Or OTC institutions that once made a lot of money on OM but failed to withdraw in time, suddenly realized that they had to take action when the situation took a turn for the worse, and they had to act against time.
At this moment, the story begins to slide in a strange direction:
Take a look at this Ethereum wallet: 0xEbb8B59780170833E455b32f57CF03DC440A77D2
It started staking OM tokens 448 days ago and began receiving rewards six days before the market crash.
Let's take a look at this chart.
The timing was clever. That wallet was linked to multiple transfers and a series of other wallets. But after several transfers, by tracing a link in the chain, we finally located the wallet 0xB37D...f26A, which was connected to an account marked as "OKX deposit address". For more background information, you can refer to this tweet , which can provide you with key clues.
It is highly likely that the wallet that started staking 448 days ago and withdrew its rewards a few days before the market crash is actually the same actor that frequently placed aggressive market limit orders on the OKX exchange.
We know this, and Binance likely knows exactly who was behind this attack.
According to the data, the market participant who frantically suppressed the order book in the Binance perpetual contract market was the main driving force behind this avalanche of selling.
That’s all for now.


You May Also Like

Pendle Accumulates $468M in STRC as Whale Activity Surges

Ox-drawn carts used to carry US aid in fuel-starved Cuba

OpenVPP accused of falsely advertising cooperation with the US government; SEC commissioner clarifies no involvement


