

XRP Price Advances Steadily, Breakout Potential Sparks Bullish Optimism
XRP price failed to surpass $1.50 and started downside correction. The price is now holding the $1.380 support and might aim for another increase.
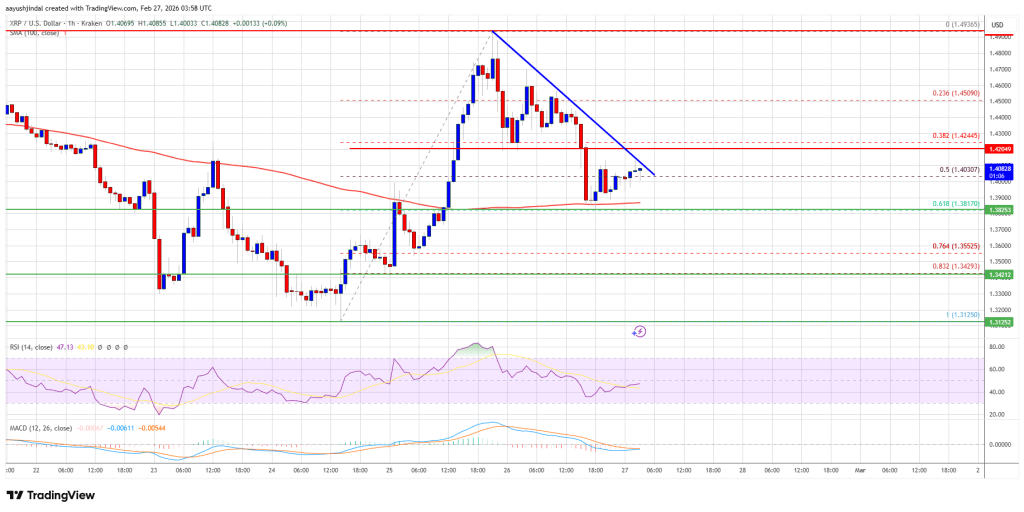
- XRP price started a downside correction and declined below $1.450.
- The price is now trading above $1.40 and the 100-hourly Simple Moving Average.
- There is a new bearish trend line forming with resistance at $1.410 on the hourly chart of the XRP/USD pair (data source from Kraken).
- The pair could start another increase if it stays above $1.380.
XRP Price Rally Cools
XRP price failed to stay above $1.480 and started a downside correction, like Bitcoin and Ethereum. The price dipped below the $1.460 and $1.450 levels to enter a negative zone.
The price even dipped below the 50% Fib retracement level of the upward move from the $1.3125 swing low to the $1.4936 high. Besides, there is a new bearish trend line forming with resistance at $1.410 on the hourly chart of the XRP/USD pair.
The bulls are now active above the $1.380 zone. The price is now trading above $1.40 and the 100-hourly Simple Moving Average. If there is a fresh upward move, the price might face resistance near the $1.410 level and the trend line. The first major resistance is near the $1.420 level, above which the price could rise and test $1.450.
A clear move above the $1.450 resistance might send the price toward the $1.50 resistance. Any more gains might send the price toward the $1.520 resistance. The next major hurdle for the bulls might be near $1.550.
Downside Continuation?
If XRP fails to clear the $1.410 resistance zone, it could start a fresh decline. Initial support on the downside is near the $1.40 level. The next major support is near the $1.3820 level or the 61.8% Fib retracement level of the upward move from the $1.3125 swing low to the $1.4936 high.
If there is a downside break and a close below the $1.3820 level, the price might continue to decline toward $1.3430. The next major support sits near the $1.3250 zone, below which the price could continue lower toward $1.3120.
Technical Indicators
Hourly MACD – The MACD for XRP/USD is now losing pace in the bearish zone.
Hourly RSI (Relative Strength Index) – The RSI for XRP/USD is now below the 50 level.
Major Support Levels – $1.40 and $1.3820.
Major Resistance Levels – $1.410 and $1.450.


You May Also Like

X Cashtags Add Real-Time Crypto Market Data

StakeStone STO Surges 76% as Liquidity Infrastructure Token Breaks Out


