

Bitcoin Price: A Forecast Sees It at $80,000

There are numerous predictions circulating about the price of Bitcoin, and usually, most of them are wrong.
Indeed, many are not the result of analysis, but rather ideas based solely on intuition or hope, and should therefore be simply ignored. However, there is one that deserves to be mentioned because it is based precisely on analysis and objective data.
It is always necessary to specify that when discussing forecasts, one must not only indicate which assets they refer to, but also specify the timeframes, because trends can vary significantly depending on the period under consideration, even to the point of moving in opposite directions.
Medium-Short Term Forecasts
In the short term, meaning over the next 24 hours or the coming days, it is very difficult to make predictions, especially because some volatility is expected that could drive the price both up and down, albeit at different times.
As for the upcoming weeks, starting from the one beginning on Monday, there might be slightly less uncertainty. To be honest, uncertainty remains high, but perhaps at least it is not extremely high.
There is an analyst working for CryptoQuant, who goes by the name CW on X, and is publishing various insights derived from CryptoQuant chart analyses, concerning whale positioning.
It should be noted that whales generally make few mistakes, or even very few, while it is primarily the retail investors who err.
CW reveals that whales are buying Bitcoin at a price slightly below $68,000, but are ready to sell at higher prices, ranging between $68,000 and $72,000.
Furthermore, it adds that the Bitcoin market is still dominated by bullish positions, as leveraged long positions amount to $4.18 billion, while short positions are only $2.10 billion.
Finally, it reveals that whale wallets with more than 100 BTC are approaching 20,000, and this would be a historically bullish signal, as large holders accumulate precisely during price declines.
Bitcoin at $80,000?
But the most important point concerning the short to medium term is another.
Indeed, CW pointed out that now, for the first time since July 2024, the so-called “whale ratio” on CryptoQuant has exceeded the 0.8 mark.
Historically, when this ratio exceeds 0.8, it indicates that a short-term price bottom has occurred.
In fact, whales typically increase their activity on exchanges when prices are low, whereas retail investors, on the contrary, tend to exit the market in these situations.
CW writes:
“If history were to repeat itself, the current price range would represent a low.”
Indeed, the Bitcoin Exchange Whale Ratio from CryptoQuant reveals that since the beginning of February, the 0.5 mark, or the midpoint, has been surpassed in favor of the whales, with two ascending peaks reached on February 14 and 21. Therefore, the low of $62,500 reached on the 24th could represent a medium-short term bottom.
All this suggests a potential rise in the price of Bitcoin, and if in the short term the barrier to overcome is $72,000, in the medium-short term this barrier shifts to $80,000.
Liquidity and Fear
Currently, the dominant dynamics driving the price of Bitcoin are twofold: liquidity and fear.
Liquidity moves it in two directions, namely upwards when it flows in and downwards when it flows out.
Fear drives it downward, although in the event of a significant reduction in fear, it should move it upward.
To track how much liquidity, in dollars, is entering or exiting the market, it is currently advisable to monitor WDTGAL, which represents the total amount of dollars held in U.S. government accounts.
In the past week, there has been a reduction, significant yet still relatively contained, and this could aid the price of Bitcoin because it means the government has released liquidity into the markets.
To track fear, it is advisable to monitor the VIX index, even though it specifically measures the implied volatility on the S&P500, which is significantly less volatile than Bitcoin and where fear has a slightly lesser effect.
Recently, the VIX reached two low peaks, not particularly high, but sufficient to significantly lower Bitcoin’s price due to liquidity drained by the US government. These peaks occurred on February 5th and 23rd. There was also one on January 20th, and since February 3rd, it has not dropped below 17 points, and it has rarely fallen below 18.
If the VIX were to drop below 18 today, or even below 17, the aforementioned scenario would become decidedly plausible.


You May Also Like
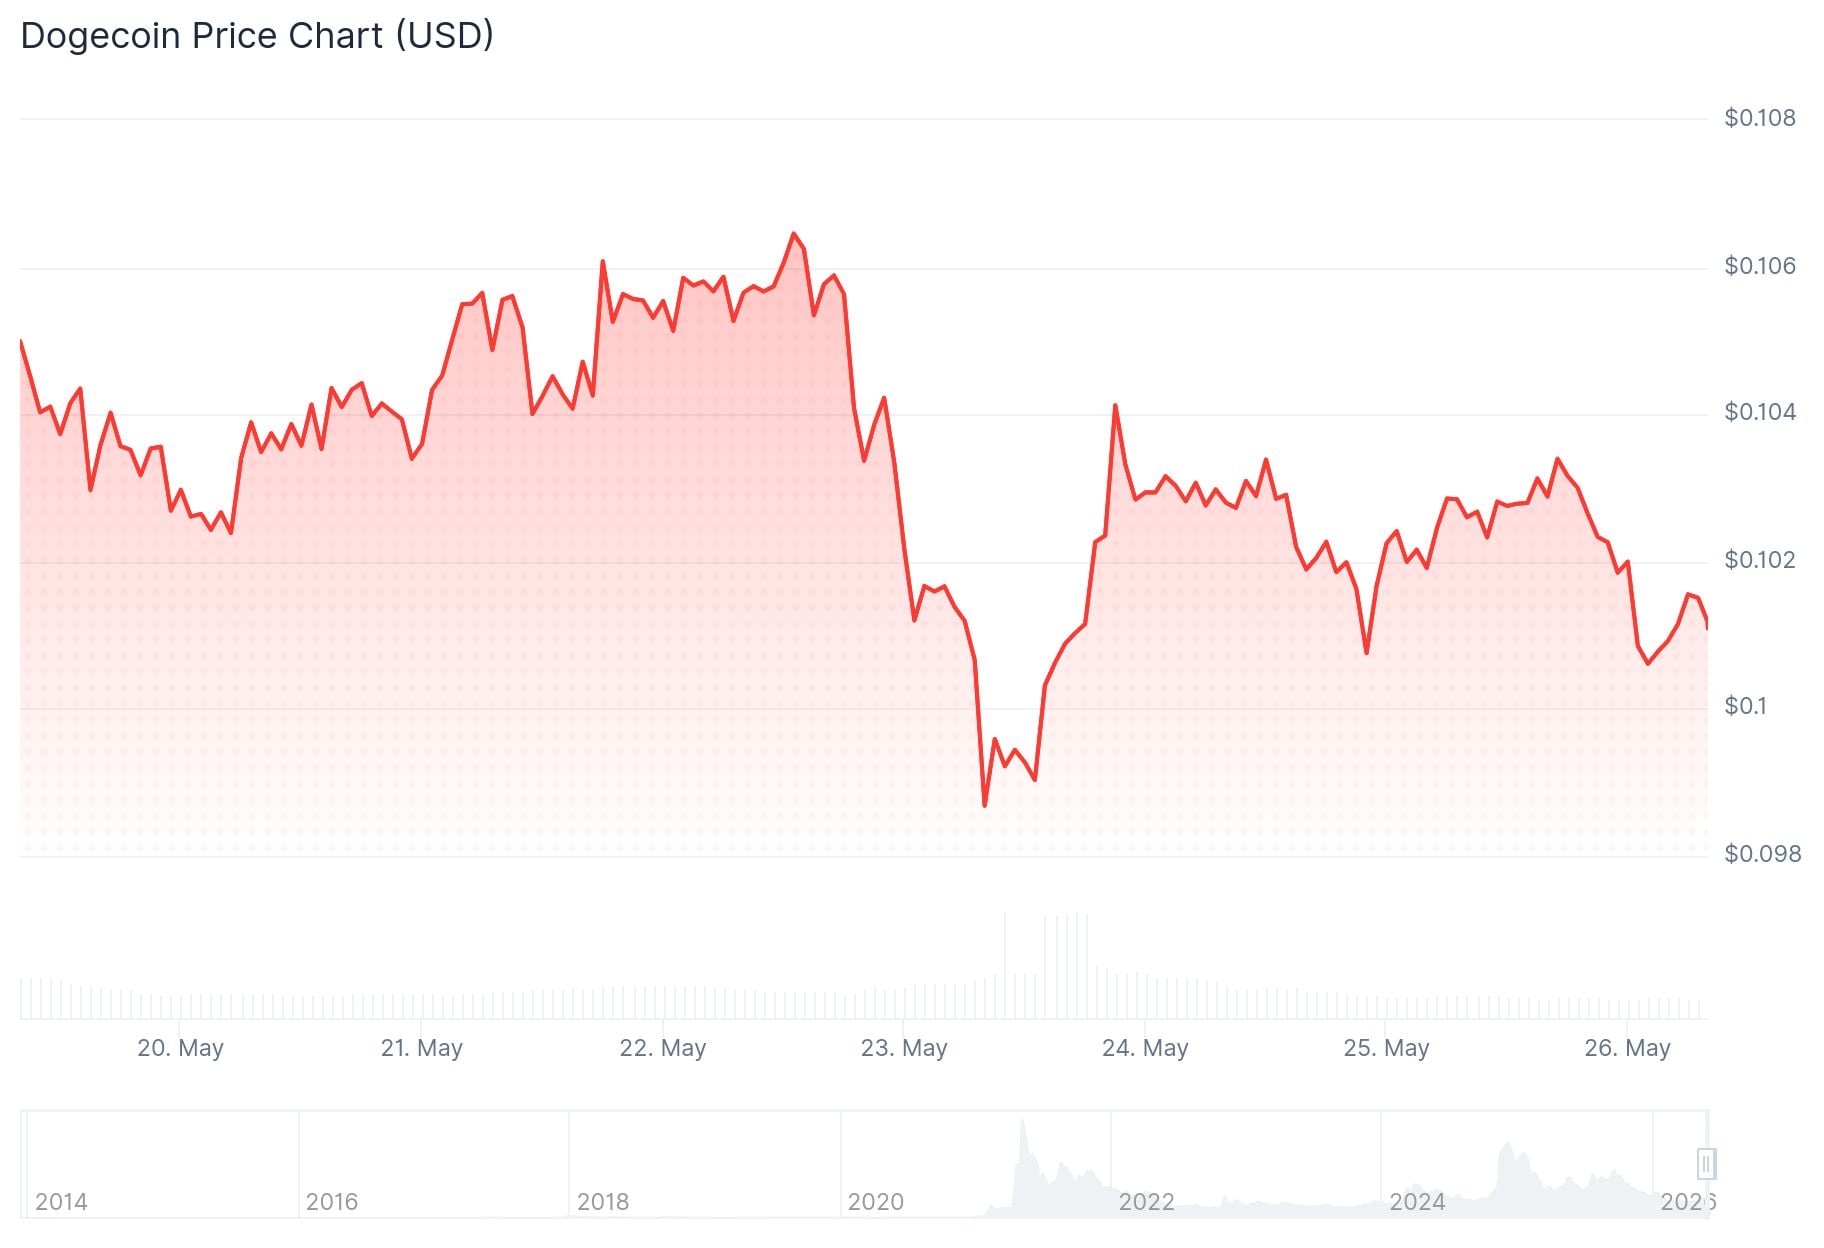
Dogecoin (DOGE) Price: ETF Inflows Hold Steady for Four Weeks as Price Tests Key Support

Chainlink Whale Activity Rises While Price Bleeds for 7 Straight Months
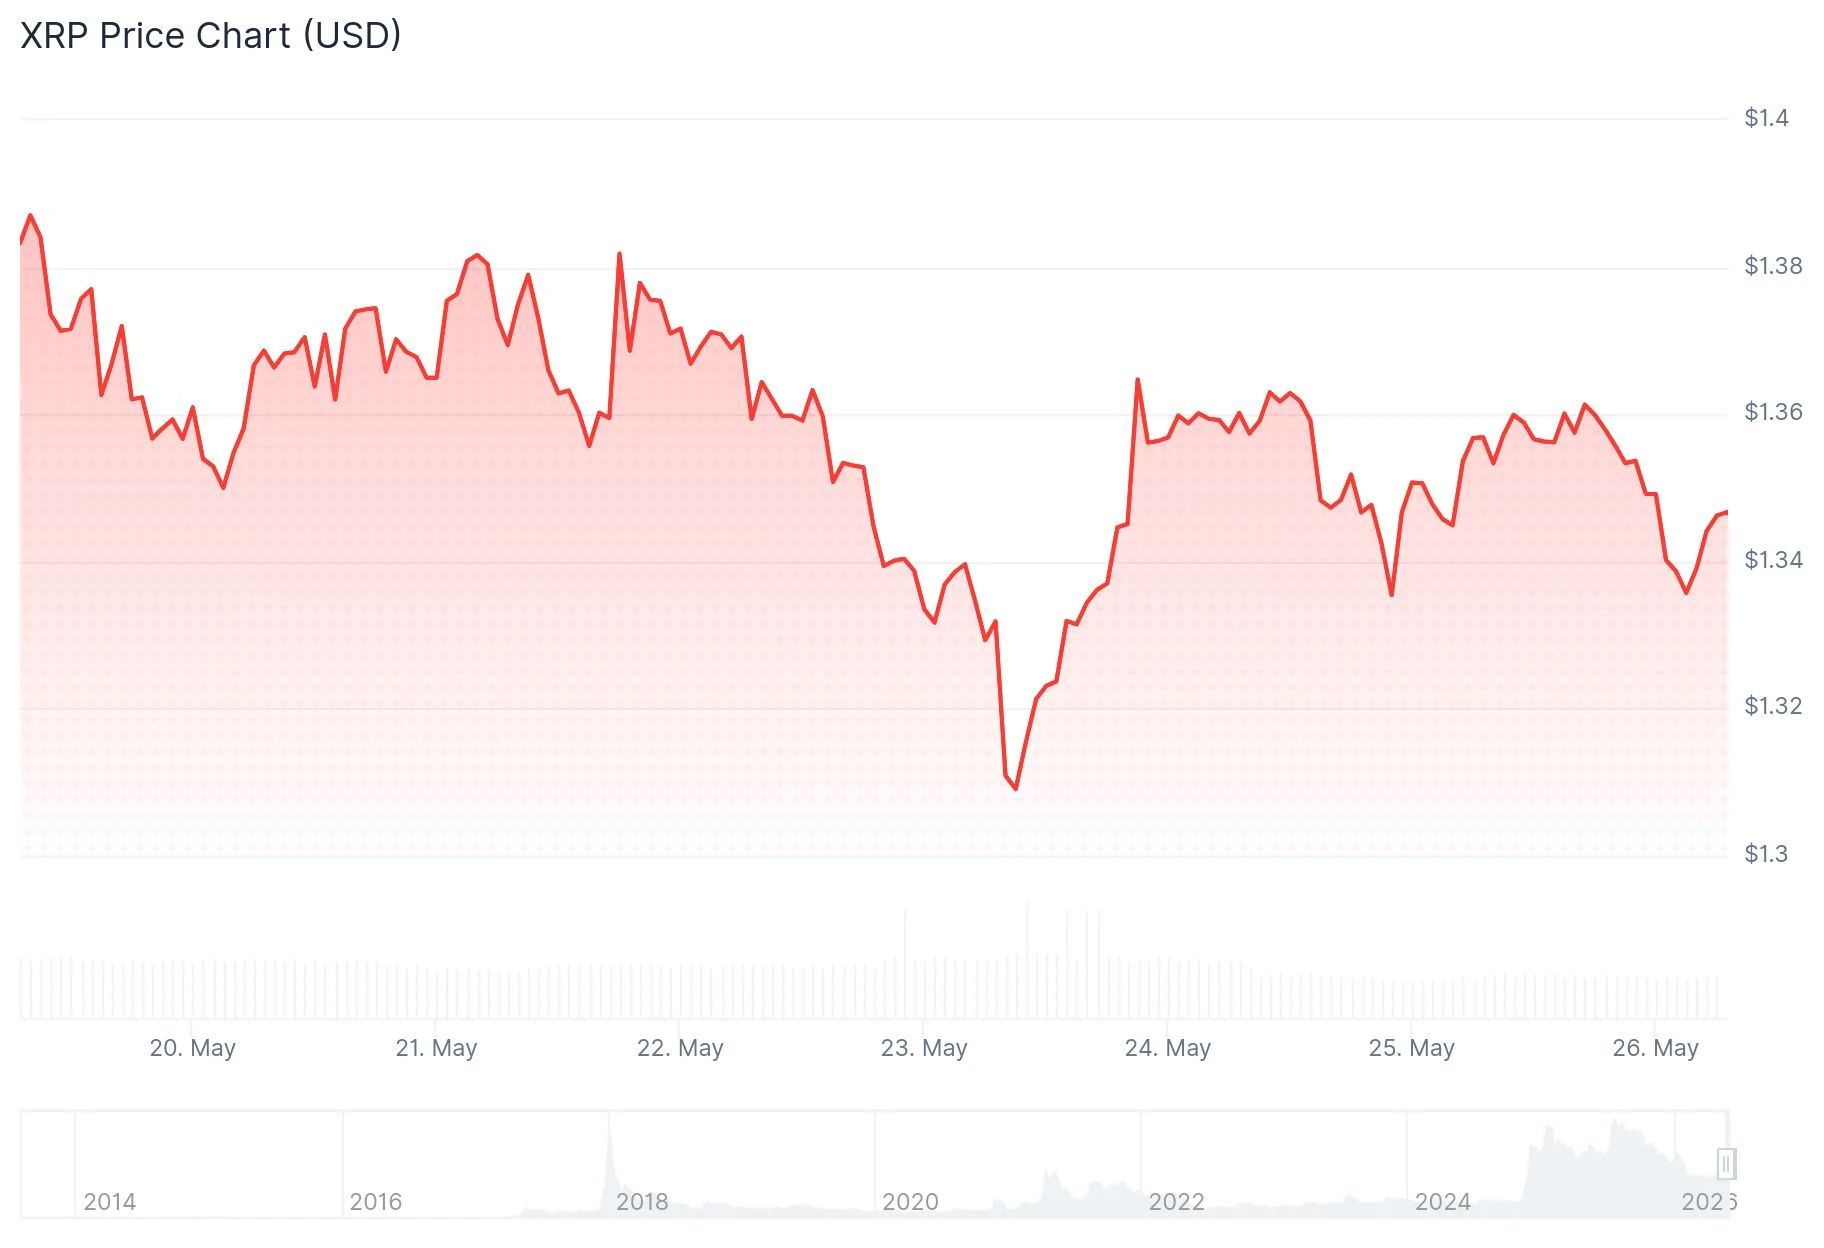
Chris Larsen’s $3.5B XRP Holdings See Fresh Blockchain Movement


