After weeks of aggressive selling pressure and a sharp liquidation cascade toward the $60K region, Bitcoin is now attempting to stabilize. The recent rebound fromAfter weeks of aggressive selling pressure and a sharp liquidation cascade toward the $60K region, Bitcoin is now attempting to stabilize. The recent rebound from

BTC Price at a Crossroads: Rebound or Trap at the Channel Mid-Line? (Bitcoin Price Prediction)

2026/02/28 00:36
3 min read

After weeks of aggressive selling pressure and a sharp liquidation cascade toward the $60K region, Bitcoin is now attempting to stabilize. The recent rebound from the $62K area has pushed the price back toward a technically critical level: the channel’s mid-boundary. This level has repeatedly acted as dynamic resistance throughout the downtrend, making the current reaction highly important for the short-term direction.

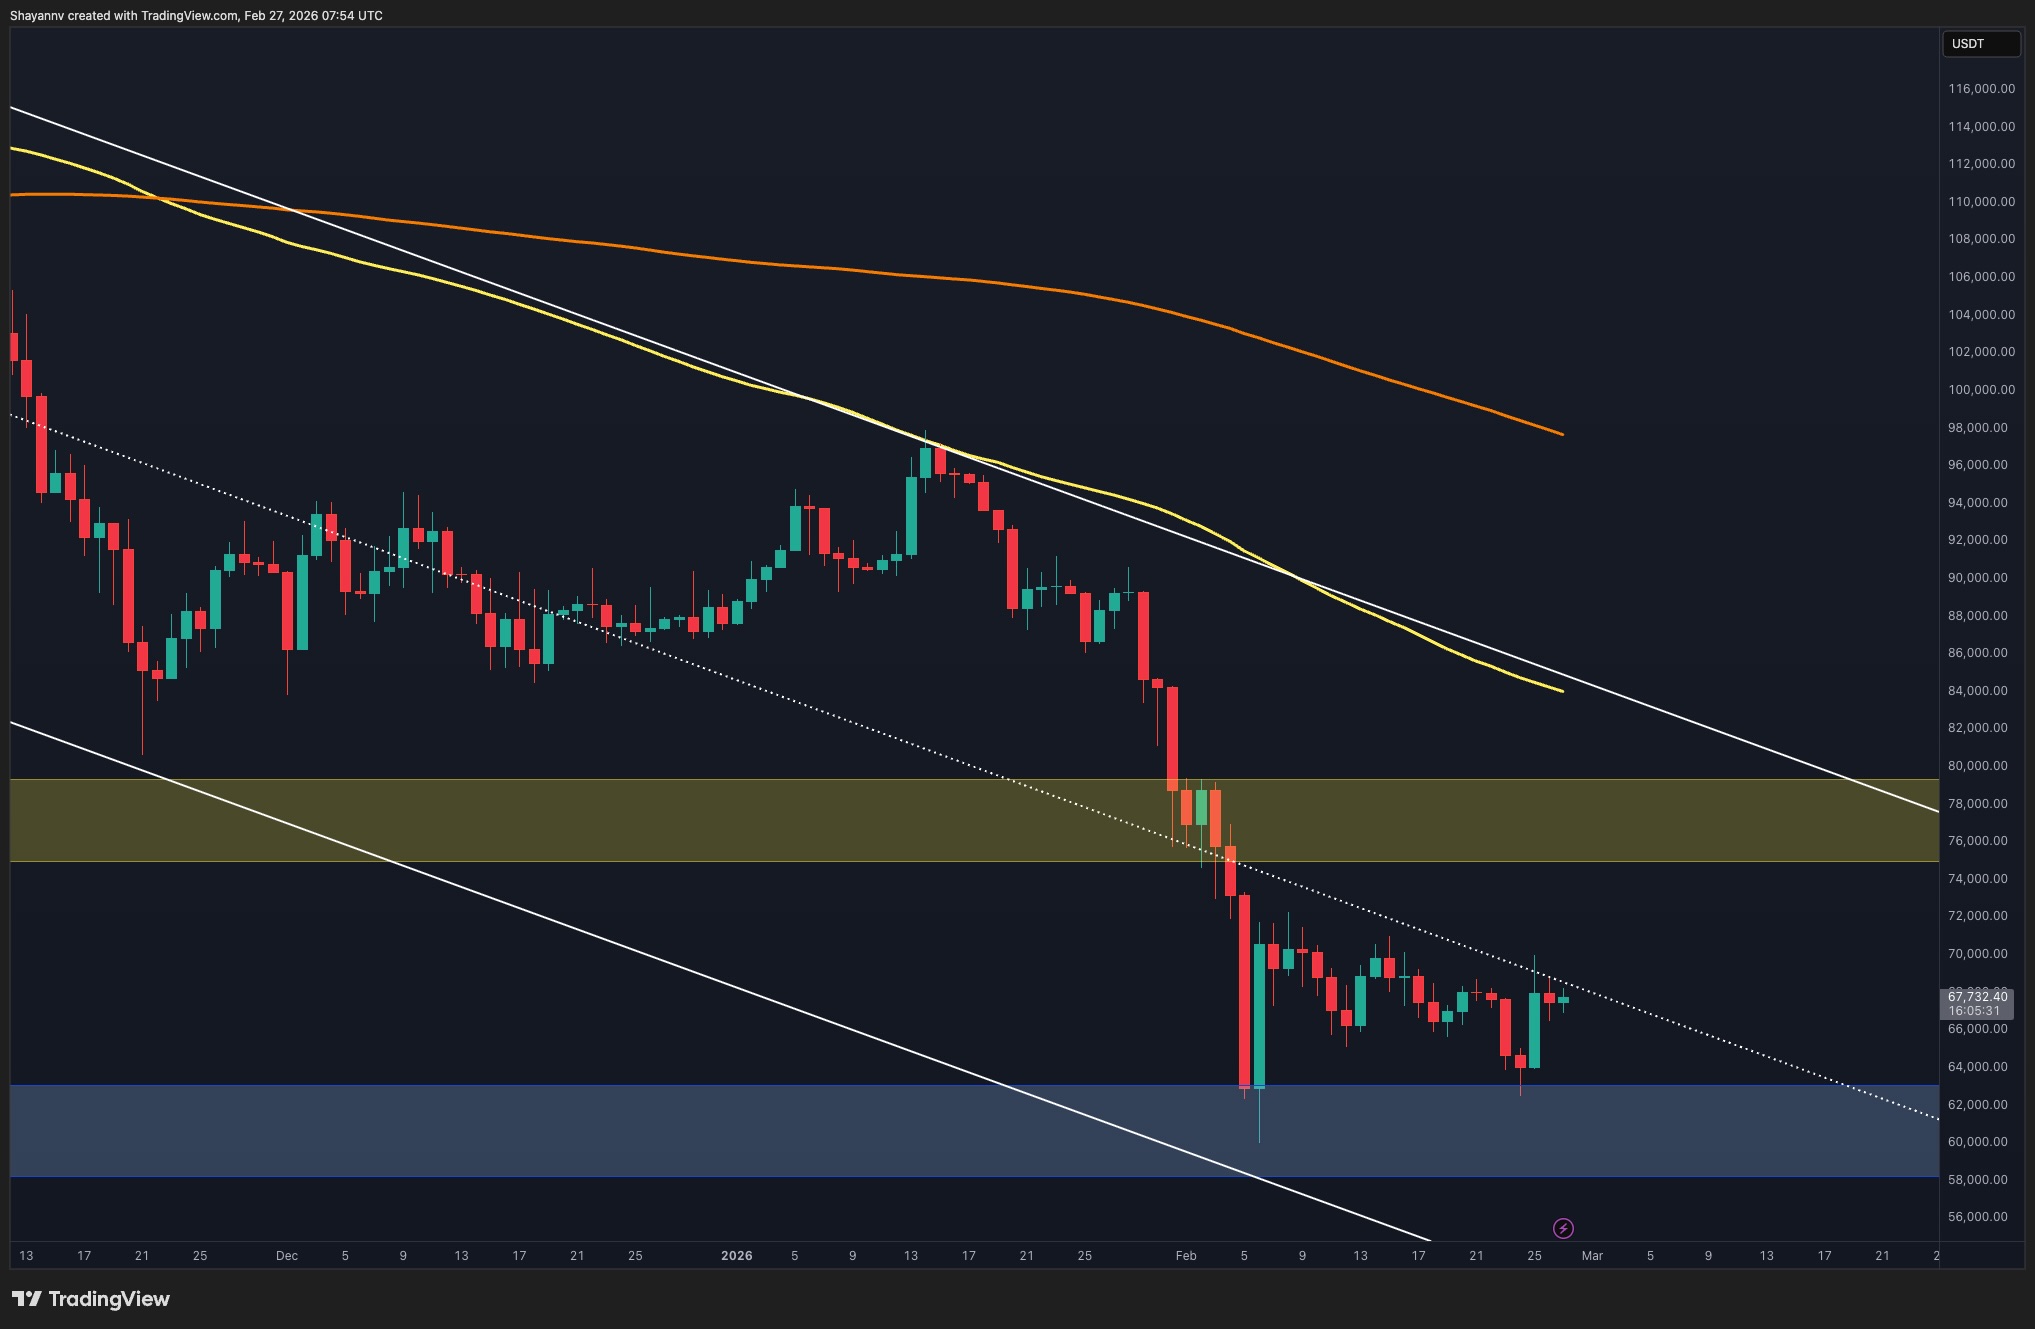
Bitcoin Price Analysis: The Daily Chart

On the daily timeframe, the bounce from $62K was technically clean. That zone acted as a strong demand and absorbed the aggressive selling pressure that triggered the previous flush. However, as the price approaches the channel’s mid-line, upside momentum is beginning to compress. The market is no longer impulsive — it is hesitating. Historically, this level has rejected multiple times, and until it is reclaimed on a daily closing basis, the broader structure remains corrective rather than bullish.

If Bitcoin can secure a strong daily close above this mid-boundary with follow-through buying, the structure shifts. In that case, the next logical magnet sits in the $75K–$80K supply region. That area contains prior distribution and would likely be the next test of strength. On the other hand, if price fails here and loses the $66K–$67K short-term support region, the market risks rotating back toward $62K. A breakdown below that level would reopen the path toward the lower boundary of the channel and confirm continuation of the larger downtrend.

btc_price_chart_2701271Source: TradingView

BTC/USDT 4-Hour Chart

On the 4-hour chart, the structure is more constructive. The recent breakout above the triangle formation at $67K signaled short-term bullish pressure returning to the market. That breakout shifted momentum, but price is now compressing between the broken triangle trendline below and the channel mid-line of $70K. This creates a short-term decision range.

A controlled pullback toward the broken triangle resistance-turned-support would be technically healthy and could provide the base for another push higher. If that support holds, continuation toward $70K becomes increasingly probable. However, losing that level would invalidate the breakout and suggest the move was merely a relief rally.

btc_price_chart_2701272Source: TradingView

Sentiment Analysis

From a liquidity perspective, the Binance BTC/USDT liquidation heatmap shows a notable cluster of short liquidations building above $70K. This area stands out clearly as a leverage pocket. Liquidity tends to act as a magnet, especially when positioned above price during a recovery phase. If Bitcoin manages to break above the channel mid-line and build acceptance, a move into that $70K region could trigger a short squeeze, accelerating upside volatility as overleveraged shorts are forced to close.

Overall, Bitcoin is in a transitional phase. The short-term structure has improved, momentum is stabilizing, and liquidity sits overhead. Yet the daily chart still shows price trapped beneath a major dynamic resistance within a broader descending channel. Until that level is decisively reclaimed, the larger structure remains fragile.

The next daily close around the channel mid-boundary will likely determine whether this rebound evolves into a squeeze toward $70K and beyond, or whether it becomes another rejection that pulls price back toward $62K and reactivates the dominant downtrend.

btc/usdt_liquidation_heatmap_chart_270227Source: CoinGlass

The post BTC Price at a Crossroads: Rebound or Trap at the Channel Mid-Line? (Bitcoin Price Prediction) appeared first on CryptoPotato.

Market Opportunity
Bitcoin Logo
Bitcoin Price(BTC)
$65,950
$65,950$65,950
-0.21%
USD
Bitcoin (BTC) Live Price Chart
Disclaimer: The articles reposted on this site are sourced from public platforms and are provided for informational purposes only. They do not necessarily reflect the views of MEXC. All rights remain with the original authors. If you believe any content infringes on third-party rights, please contact [email protected] for removal. MEXC makes no guarantees regarding the accuracy, completeness, or timeliness of the content and is not responsible for any actions taken based on the information provided. The content does not constitute financial, legal, or other professional advice, nor should it be considered a recommendation or endorsement by MEXC.

You May Also Like

BlackRock boosts AI and US equity exposure in $185 billion models

BlackRock boosts AI and US equity exposure in $185 billion models

The post BlackRock boosts AI and US equity exposure in $185 billion models appeared on BitcoinEthereumNews.com. BlackRock is steering $185 billion worth of model portfolios deeper into US stocks and artificial intelligence. The decision came this week as the asset manager adjusted its entire model suite, increasing its equity allocation and dumping exposure to international developed markets. The firm now sits 2% overweight on stocks, after money moved between several of its biggest exchange-traded funds. This wasn’t a slow shuffle. Billions flowed across multiple ETFs on Tuesday as BlackRock executed the realignment. The iShares S&P 100 ETF (OEF) alone brought in $3.4 billion, the largest single-day haul in its history. The iShares Core S&P 500 ETF (IVV) collected $2.3 billion, while the iShares US Equity Factor Rotation Active ETF (DYNF) added nearly $2 billion. The rebalancing triggered swift inflows and outflows that realigned investor exposure on the back of performance data and macroeconomic outlooks. BlackRock raises equities on strong US earnings The model updates come as BlackRock backs the rally in American stocks, fueled by strong earnings and optimism around rate cuts. In an investment letter obtained by Bloomberg, the firm said US companies have delivered 11% earnings growth since the third quarter of 2024. Meanwhile, earnings across other developed markets barely touched 2%. That gap helped push the decision to drop international holdings in favor of American ones. Michael Gates, lead portfolio manager for BlackRock’s Target Allocation ETF model portfolio suite, said the US market is the only one showing consistency in sales growth, profit delivery, and revisions in analyst forecasts. “The US equity market continues to stand alone in terms of earnings delivery, sales growth and sustainable trends in analyst estimates and revisions,” Michael wrote. He added that non-US developed markets lagged far behind, especially when it came to sales. This week’s changes reflect that position. The move was made ahead of the Federal…
Share
BitcoinEthereumNews2025/09/18 01:44
Litecoin Fluctuates Below The $116 Threshold

Litecoin Fluctuates Below The $116 Threshold

The post Litecoin Fluctuates Below The $116 Threshold appeared on BitcoinEthereumNews.com. Sep 17, 2025 at 23:05 // Price Litecoin price analysis by Coinidol.com: LTC price has slipped below the moving average lines after hitting resistance at $120. Litecoin price long-term prediction: bearish The 21-day SMA support helped to alleviate the selling pressure. In other words, the price of the cryptocurrency is above the 21-day SMA support but below the 50-day SMA barrier. This suggests that Litecoin will be trapped in a narrow range for a few days. If the 21-day SMA support or the 50-day SMA barrier is overreached, the cryptocurrency will trend upwards. For example, if the LTC price breaks through the 50-day SMA barrier, it will rise to a high of $124. Litecoin will fall to its current support level of $106 if the 21-day SMA support is broken. Technical Indicators  Resistance Levels: $100, $120, $140 Support Levels: $60, $40, $20 LTC price indicators analysis Litecoin’s price is squeezed between the moving average lines. It is unclear in which direction Litecoin will move. The moving average lines are horizontal in both charts. However, the price bars are limited to the distance between the moving averages. The price bars on the 4-hour chart are below the moving average lines. LTC/USD price chart – September 17, 2025 What is the next move for LTC? On the 4-hour chart, Litecoin is currently trading in a bearish trend zone. The altcoin is trading above the $112 support and below the moving average lines, which represent resistance at $116. The upward movement is hindered by the moving average lines, which are causing the price to oscillate within a limited range. Meanwhile, the signal for the cryptocurrency is bearish, with price bars below the moving average…
Share
BitcoinEthereumNews2025/09/18 08:15
TBC Bank Recognized as a Fintech Leader in Uzbekistan for AI and Digital Innovation

TBC Bank Recognized as a Fintech Leader in Uzbekistan for AI and Digital Innovation

TBC Bank, a prominent player in Uzbekistan’s banking sector, has rapidly become one of the leaders in fintech, driving digital transformation and innovative financial
Share
Techbullion2026/02/28 08:39