KAS, despite a modest weekly rise of %1.89, maintains its main downtrend structure and is stuck in a narrow trading range. The market structure points to testing critical support levels, while Bitcoin’s bearish supertrend necessitates a cautious approach for altcoins.
KAS in the Weekly Market Summary
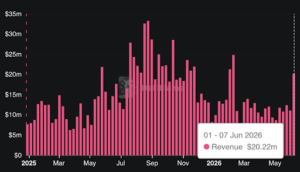
KASUSDT spent the week in a narrow range at the $0.03 level ($0.03 – $0.03), recording a modest %1.89 rise. Volume profile remains low at $16.20M, indicating market participants’ indecision in determining direction. Main trend defined as downtrend, RSI at 42.28 in the neutral zone, MACD histogram positive but overall momentum weak. Trading below short-term EMA20 ($0.03), with $0.04 resistance representing the trend filter. For more detailed data, check the KAS detailed spot analysis page. In the big picture, KAS shows accumulation phase signals, but macro downtrend pressure persists. For position traders, multi-timeframe confluences and Bitcoin correlation are critically important this week.
Trend Structure and Market Phases
Long-Term Trend Analysis
The long-term trend structure shows a clear downtrend character; on higher timeframes (1W/1M), lower highs and lower lows continue to form. Price is moving within the main descending channel, with the channel’s upper band around $0.04 forming strong resistance. The trend remains intact so far: as long as the $0.0291 major support is not broken. Although MACD shows the start of a positive histogram, the signal line crossover has not yet occurred, indicating momentum has not fully reversed. In the market cycle context, KAS is giving signals of transitioning from distribution phase to accumulation after the rally at the end of 2025, but the global risk-off environment limits this. For portfolio managers, breaking the $0.0440 upside objective is required for a long-term trend change, which could trigger a channel breakout.
Accumulation/Distribution Analysis
Accumulation phase characteristics are becoming prominent: Price has stabilized in the $0.0291-$0.0310 support cluster, and although volume is low, accumulation blocks are visible in the volume profile at these levels (score 66/100). However, distribution patterns emerge at $0.0331 resistance (score 73/100); short-term sellers are active here. According to Wyckoff methodology, this narrow range could be preparing for a ‘spring’ test, but due to downtrend filtering, fakeout risk is high. Out of 13 strong levels, 3D timeframe shows 5 support/1 resistance confluence, providing an argument in favor of accumulation, but 1W balanced distribution (3S/3R) requires caution. If distribution signals strengthen, $0.0146 downside risk may come into play.
Multi-Timeframe Confluence
Daily Chart View
On the daily chart, price exhibits bearish short-term structure below EMA20 ($0.03). 1D breakdown: 1 support/2 resistance, with $0.0310 intermediate support and $0.0331 main resistance confluence dominant. RSI 42.28 not approaching oversold, MACD shows bullish divergence but trend filter is bearish. Critical inflection point $0.0291; it aligns with daily pivot and volume cluster. If price holds here, short-covering rally could extend to $0.0331. For futures trading, follow KAS futures market data.
Weekly Chart View
From the weekly perspective, downtrend intact; market phase stuck between accumulation/distribution with 3S/3R balance. Weekly candles show doji-like indecision, %1.89 change reflects low volatility. Supertrend bearish, EMA50 ($0.035) acting as resistance. Confluence: $0.0291 aligns with 1W support and 3D support, offering strong holding potential in multi-TF confluence. Breakout target $0.0440, R/R ratio around 1:2.5 attractive.
Critical Decision Points
Main levels that will determine market direction: Major support $0.0291 (66/100 score, multi-TF confluence), intermediate $0.0310 (63/100). Resistances $0.0331 (73/100, short-term trend filter), $0.04 (long-term channel upper). Upside objective $0.0440 (26 score), downside risk $0.0146 (22 score). These levels should be confirmed with volume spikes on breakout. Visit the KAS and other analyses page for all analyses. Market structure maintains bullish bias as long as $0.0291 holds, but BTC pressure may delay reversal.
Weekly Strategy Recommendation
In Case of Rise
Bullish scenario: Activate long positions on $0.0331 breakout and close, target $0.0440 (R/R 1:3). Stop-loss below $0.0291, partial profit at $0.037. Wait for momentum confluence (MACD cross + RSI>50). Position size %2-3 of portfolio, manage with trailing stop on EMA20. Volume increase required for accumulation phase confirmation.
In Case of Fall
Bearish scenario: Short opportunities on $0.0291 breakdown, target $0.0146. Stop above $0.0331. Downtrend continuation probability high, especially with BTC weakness. Risk management: Max %1 position, wait for distribution confirmation.
Bitcoin Correlation
BTC in downtrend at $67,479 level, despite 24h +%2.97, supertrend bearish – caution signal for altcoins. If BTC key supports $67,276 / $65,027 break, it accelerates KAS $0.0291 test. Resistances $67,358 / $70,551; if BTC breaks here, it supports KAS $0.0331 breakout. Correlation ~0.75; BTC dominance rise pressures KAS, this week BTC weakness below $65k could lead to altcoin dump.
Conclusion: Key Points for Next Week
To watch next week: $0.0291 support hold vs break, $0.0331 resistance test, BTC $67k dynamics, and volume profile. While trend structure remains downtrend, wait for confluence for accumulation breakout. Position traders, stay R/R focused; preserve liquidity in macro risk-off.
This analysis uses Chief Analyst Devrim Cacal’s market views and methodology.
Source: https://en.coinotag.com/analysis/kas-technical-analysis-march-1-2026-weekly-strategy