Smart Money Is Moving Into Bitcoin While Retail Quietly Walks Away
Two CryptoQuant datasets published this week show diverging behavior across investor types: US spot ETFs absorbed approximately 21,000 BTC worth $1.45 billion on February 25th while retail inflows to Binance contracted by $5 billion over the past month.
The ETF Spike
The Bitcoin + US Spot ETF Flows chart from Adler Insight tells a simple story visually. From early October through late February, total ETF holdings declined in a near-continuous staircase. The yellow line dropped from approximately 1.35 million BTC at the peak to around 1.26 million BTC by mid-February, a reduction of roughly 90,000 BTC across the five-month drawdown period.
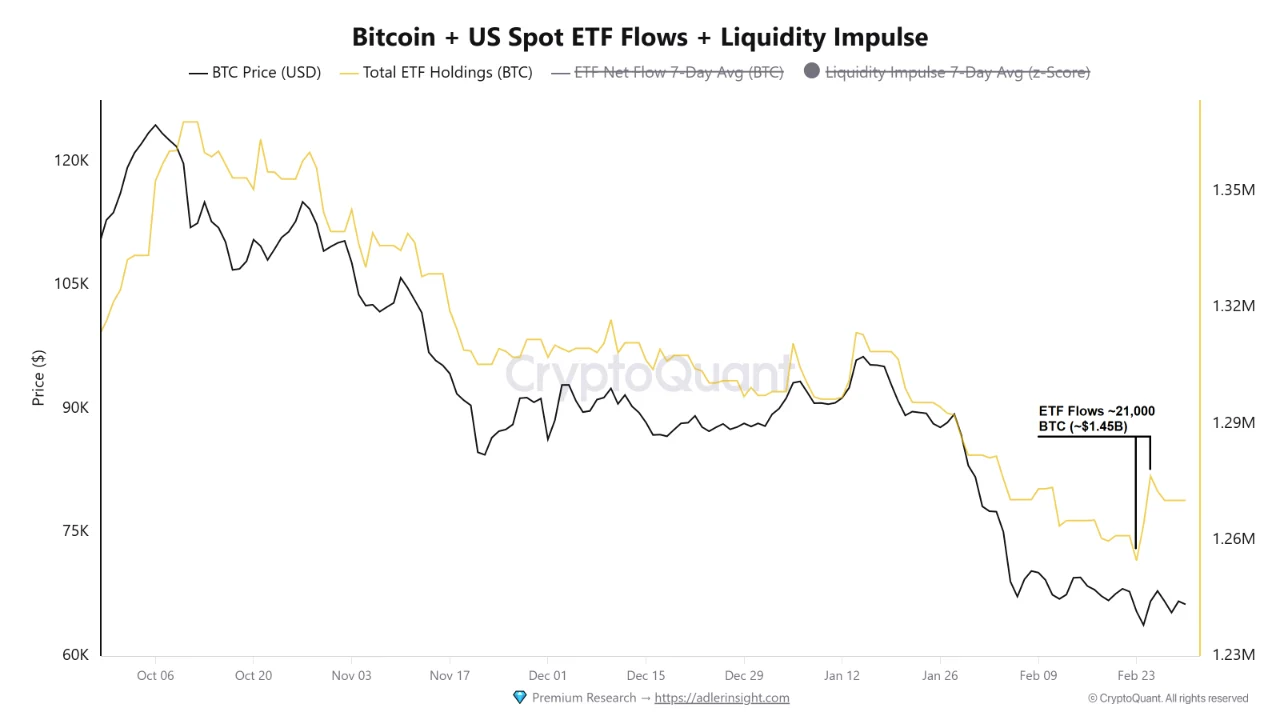 Then February 25th happened. The annotation on the chart marks it directly: ETF flows of approximately 21,000 BTC, equivalent to $1.45 billion. The yellow line ticks sharply upward for the first time since October. One day. One spike. The first meaningful accumulation event in the products since the cycle peak.
That’s not nothing. It’s also not enough on its own. One day of significant inflows after five months of outflows is notable, not conclusive. The chart’s price line continues trading sideways near $66,000 in the sessions following the spike, suggesting the inflow hasn’t translated to price follow-through yet.
What Retail Is Doing on Binance
The Binance Whale to Exchange Flow chart tracks retail and whale inflows on a 30-day rolling basis, and retail is telling a very different story than the ETF spike might suggest.
From February 6 to March 2, the light blue retail inflow band contracted from $14.1 billion to $9.05 billion. That’s a $5 billion decline in 30-day cumulative retail flows in under four weeks. Retail is not buying this dip. At least not on Binance.
The chart annotates two prior instances of comparable retail inflow contractions. March to April 2025 saw a net decline of $8 billion. June 2025 saw a net decline of $5 billion. Both contractions happened before price moved significantly. The first preceded the rally to $120,000 peak levels. The second preceded a consolidation period before the next leg.
Neither of those analogies tells you the same thing. The March 2025 contraction was followed by a major price advance. The June 2025 contraction wasn’t. Context around the contractions mattered more than the contractions themselves.
Reading Both Charts Together
Put the two datasets side by side and a specific picture emerges. Retail is pulling back from Binance at a pace consistent with prior pattern inflection points. Institutions, or at least ETF-level buyers, injected $1.45 billion in a single session on February 25th after months of steady selling.
That divergence has a name in market cycle analysis. It’s called a handoff, retail distribution into institutional accumulation, or retail exhaustion before smart money repositions. Whether that’s what’s happening here or whether the ETF spike was a one-day anomaly that doesn’t repeat is the question the next few weeks will answer.
What the data confirms right now: retail flows are contracting at a historically meaningful rate, and the first large ETF inflow in five months appeared on the same week the contraction hit its most recent floor. That timing isn’t random. Whether it’s significant is still open.
The post Smart Money Is Moving Into Bitcoin While Retail Quietly Walks Away appeared first on ETHNews.


You May Also Like

Major Shift in Crypto-Backed Investment Yield Approaches
BREAKING: ETHGas (GWEI) Surges 20.9% to $0.087 in 24 Hours