

Intraday Heat Meets Daily Pressure for Shiba Inu today price

The market is attempting a rebound under a cloud of fear, and the behavior of Shiba Inu today price reflects that uneasy balance between speculation and structural weakness.
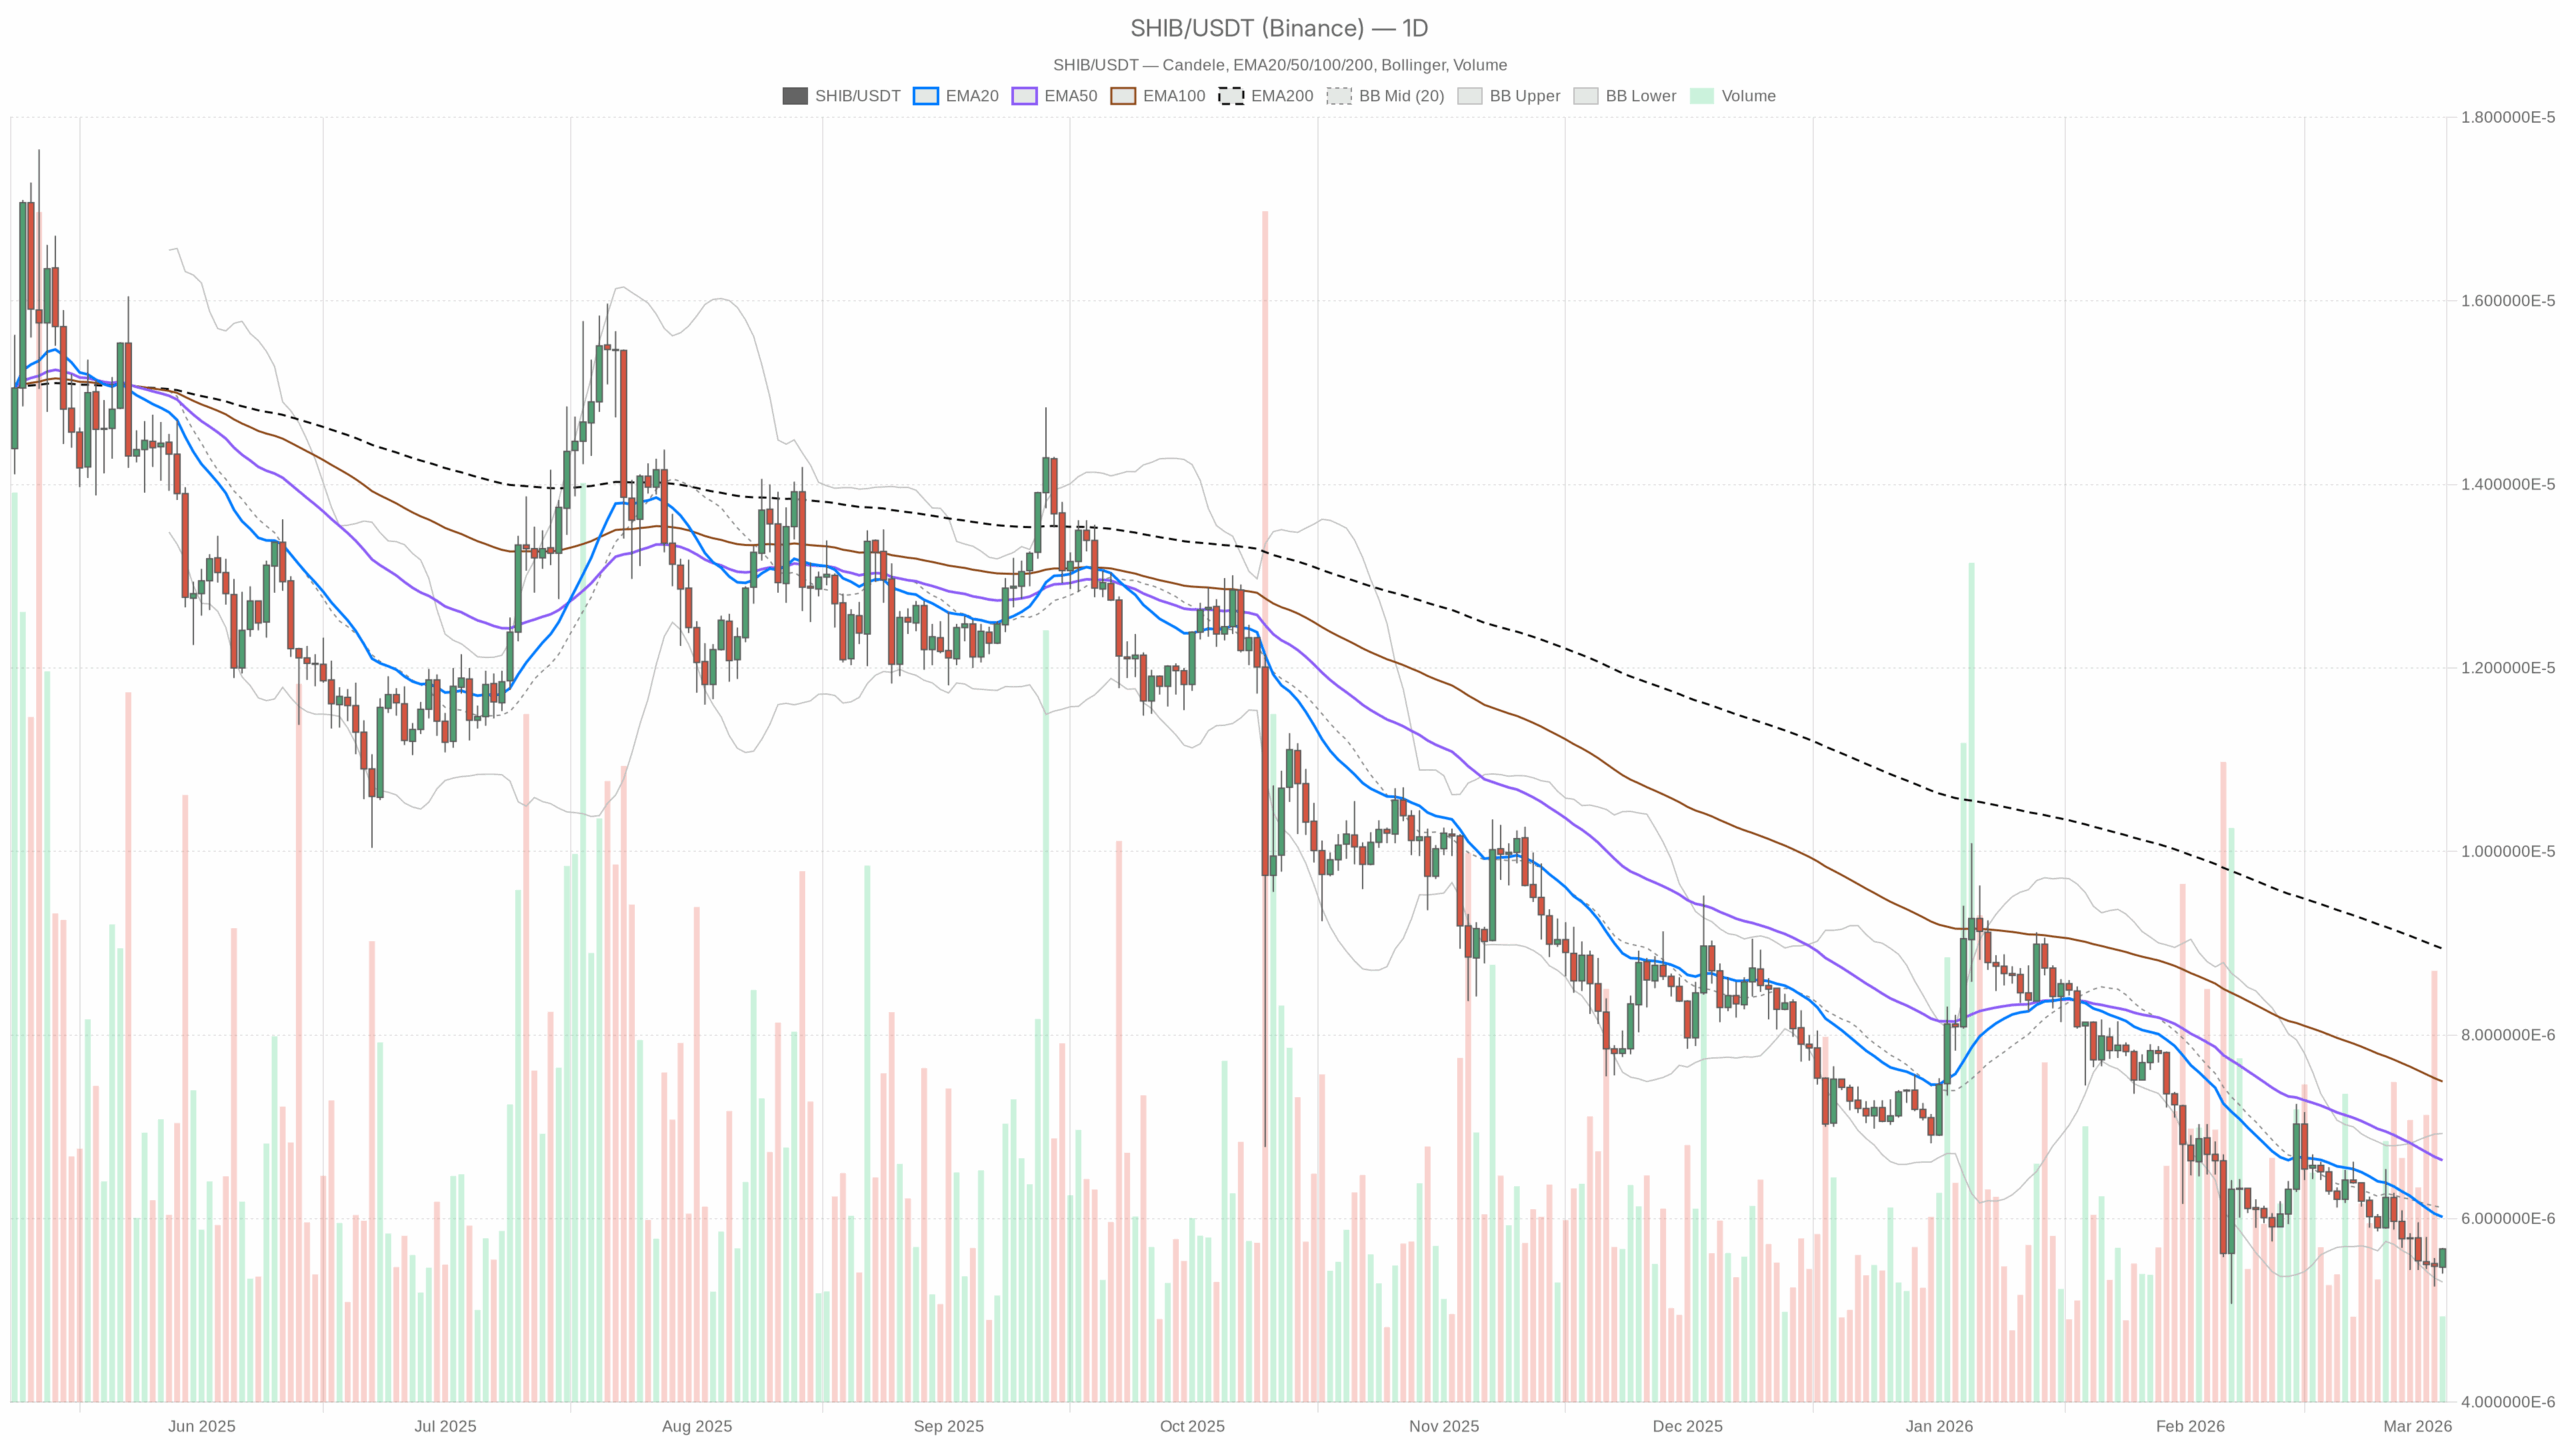 SHIB/USDT — daily chart with candlesticks, EMA20/EMA50 and volume.
Dominant Market Force: Short-Term Speculation vs. Structural Weakness
Shiba Inu (SHIB/USDT) is caught in a classic squeeze between short-term speculation and a weak higher timeframe backdrop. The broader crypto market is rebounding, total market cap is up over 5% in 24 hours, yet sentiment sits in Extreme Fear with a Fear & Greed Index at 10. That combination — price bounce in a fearful market — usually means short-covering and opportunistic scalping rather than deep conviction buying.
On the daily timeframe, SHIB is locked in a bearish regime. On the intraday charts (1H and 15m), momentum is stretched to the upside. In other words, the main trend is still down or under pressure, but today’s tape shows a strong counter-trend push that can easily snap back if liquidity dries up or if the broader rebound stalls.
Bitcoin dominance at roughly 57% tells you capital is crowding into BTC and, to a lesser extent, majors. Meme coins like Shiba Inu are further out on the risk curve, so they tend to get whipped around more aggressively when sentiment is this fragile. Moreover, with DeFi fees down sharply on key DEXs like Uniswap V3 and Curve, on-chain speculative activity is not exactly roaring; this adds to the sense that today’s move is more about active traders than a broad retail wave.
Put simply, the market is nervous, defensive capital sits in BTC and stablecoins, and SHIB is trying to rally inside that environment. That is a tough backdrop for sustained trending moves unless the rest of the crypto complex follows through.
Daily Timeframe (D1): Macro Bias Still Bearish
Trend & Regime
The daily regime for SHIBUSDT is flagged as bearish. We do not have reliable EMA or price levels in the dataset, but the regime tag itself tells us price action has been aligning below key moving averages and/or in a downward or heavy consolidation structure.
Interpretation: The higher timeframe is still pointing down or at least not supportive of a sustained uptrend. Any rally today is working against that macro bias and has a lower probability of smooth continuation unless structure genuinely changes on the daily chart.
Daily RSI (14)
RSI (14) D1: 39.25
An RSI in the high 30s is below the midline but not yet oversold. This is typical of a market in a mild to moderate downtrend or in a basing phase after weakness.
Interpretation: Daily momentum is still tilted to the downside. SHIB is not washed out enough to scream capitulation bottom, but it is weak enough that rallies can quickly run into supply from holders looking to exit at better prices.
Daily MACD
MACD D1: near flat (line ≈ signal, histogram ≈ 0)
With line, signal, and histogram effectively flat in the data, daily MACD is not providing a strong trend signal.
Interpretation: On the higher timeframe, SHIB lacks clear directional momentum. The regime is labeled bearish, but MACD being flat suggests the downtrend may be slowing or pausing rather than accelerating. It is more of a grinding environment than a clean trend.
Bollinger Bands (D1)
The dataset gives no meaningful band levels, but combining the bearish regime with sub-50 RSI, price is likely hanging in the lower half of its recent volatility range.
Interpretation: SHIB is probably not in the kind of explosive expansion phase where it rips one way for days. It is more likely oscillating with a bearish lean, with lower highs and potentially lower lows unless buyers step in aggressively.
ATR & Pivots (D1)
ATR and daily pivot levels are not usable from this feed, so we lean on the broader volatility context: total crypto volume is slightly down (~3.4% over 24h) while market cap is up. That is classic of up on light volume, often driven by short covering.
Interpretation: Volatility can spike quickly from here. In a fearful market, low-volume bounces are fragile; once intraday buyers step back, the move can unwind faster than it built.
1-Hour Timeframe (H1): Overheated Short-Term Momentum
Regime & Structure
The 1H regime is tagged as neutral. That usually corresponds to price chopping around key intraday moving averages, sometimes after a breakout or breakdown.
Interpretation: The intraday trend is not firmly established. SHIB can swing both ways on news or BTC moves, and mean-reversion trades are attractive for scalpers when the regime is neutral but oscillators are stretched.
RSI (14) H1
RSI (14) H1: 70.95
On the one-hour chart, RSI is just over the classic overbought threshold.
Interpretation: Short-term momentum is running hot. That does not mean price must fall immediately, but the easy part of today’s intraday move is likely behind us. From here, every new high has to fight profit-taking and fresh short interest.
MACD, EMAs, Bollinger Bands, ATR, Pivots (H1)
MACD is recorded as flat in the raw data, while the regime is neutral and RSI stretched. That mix often appears when price has made a fast move, but the trend engine has not had time to adjust.
Interpretation: The 1H chart looks more like a sudden burst of momentum in a choppy market than the start of a clean trending leg. Without clear EMA alignment or band expansion data, traders should treat this as a potentially short-lived spike until proven otherwise. This is where the dynamics around Shiba Inu today price are most noticeably driven by fast money and sentiment shifts.
15-Minute Timeframe (M15): Tactical Execution Zone
RSI (14) M15
RSI (14) M15: 77.15
This is even more overheated than the 1H reading. On a 15-minute chart, RSI above the mid-70s is exactly where intraday reversals or at least sideways consolidations often begin.
Interpretation: Very short-term momentum traders have already chased the move. From an execution standpoint, this is late to the party for fresh aggressive longs; the asymmetry starts to favor either pullback entries or fade setups, depending on your bias and risk appetite.
15-Minute Regime & Structure
The regime is again neutral despite the high RSI, echoing the 1H structure.
Interpretation: The tape is noisy. SHIB can run a bit further on momentum, but the lower timeframes are primed for sharp snapbacks if larger players decide to offload into strength.
How the Timeframes Fit Together
Here is the core tension:
- Daily: Bearish regime, RSI below 40, MACD flat. The macro bias leans bearish or, at best, weak consolidation after a down move.
- 1H & 15m: Neutral regimes with overbought RSI readings (around 71 and 77). Short-term momentum is firmly up but stretched.
That mismatch — higher timeframe weakness vs. lower timeframe overextension — typically resolves one of two ways:
- The intraday squeeze forces a proper daily trend reversal: structure shifts, volume builds, and the daily chart turns from bearish to neutral or bullish.
- The intraday move burns out, and price mean-reverts back down in line with the existing daily bearish bias.
Given Extreme Fear in overall sentiment and capital concentration in BTC and stables, the second outcome is more common historically, unless we see a clear pickup in breadth and volume across altcoins.
Scenario Map for SHIB/USDT
Main Scenario (Based on D1): Bearish Bias
The primary scenario remains bearish because the daily regime is down and daily RSI is below the midline. Intraday rallies are working against that backdrop, which statistically favors mean-reversion lower after spikes.
Bullish Scenario: Intraday Strength Turns into a Daily Reversal
In the bullish case, today’s overbought intraday readings are not the end of the move but the start of a regime change.
What the bullish path looks like:
- On the 1H and 15m, RSI cools from the 70–77 zone not via heavy selling, but through sideways consolidation while price holds near or makes slightly higher highs.
- MACD on the 1H begins to turn decisively positive (signal line crossover with a growing histogram) as more volume comes in, confirming that this is more than a quick squeeze.
- On the daily, RSI climbs back above 45–50 over the next sessions, dragging the regime toward neutral or even bullish as price stabilizes above previous resistance areas.
For traders, this bullish roadmap implies:
Dip-buyers would be looking for shallow pullbacks on the 15m/1H (where RSI resets toward 50–60, not 30) while the daily chart gradually builds a higher low. The key is that every sell-off gets absorbed quickly and fails to break back into the recent daily low zone.
What invalidates the bullish scenario?
- If 1H RSI dumps from the low 70s straight into the 30s with wide candles and increased volume, it indicates a failed breakout and trapped longs.
- If daily RSI rolls over from the high 30s without ever reclaiming the 50 level, it confirms the bounce was transitory and the bearish regime is intact.
Bearish Scenario: Intraday Exhaustion and Reversion to Trend
In the bearish case, SHIB’s current pump is simply an overshoot in a structurally weak market, and price bleeds lower once short-term buyers run out of ammunition.
What the bearish path looks like:
- On the 15m, RSI above 77 fails to sustain; price forms a short-term top pattern (double top, lower high, or failed breakout) and pulls back sharply.
- The 1H RSI slips from 70+ back below 50 while the regime shifts from neutral toward bearish, signaling that bears have retaken control intraday.
- On the daily, RSI stays stuck in the 30–40 range or dips closer to 30, reflecting renewed selling pressure with no meaningful structural change.
For traders, this bearish roadmap implies:
Short-biased traders would look for failed rallies on the 15m/1H, especially when fresh highs are not confirmed by momentum, and fade strength back into the direction of the daily regime. Risk would be defined above the intraday highs that triggered the overbought readings.
What invalidates the bearish scenario?
- If the 1H RSI spends time above 60–70 while price continues to print higher lows and MACD turns decisively positive, the market is transitioning into a sustained up-leg.
- If the daily regime tag eventually flips from bearish to neutral/bullish and RSI holds above 50, the notion of just a dead cat bounce no longer fits.
Positioning, Risk, and Uncertainty
For anyone active in SHIB/USDT today, the key is respecting the timeframe conflict:
- The daily chart says: be cautious with chasing upside — the bigger trend is still under pressure.
- The intraday charts say: momentum is hot, but late entries are dangerous with RSI already stretched.
The wider environment also matters. Extreme Fear, high BTC dominance, and soft aggregate volumes are not the backdrop where meme coins typically lead a new bull cycle. They are the kind of conditions where sharp rallies can and do happen, but they are often short-lived and punishing to traders who ignore risk limits.
In this context, shorter-term participants may treat SHIB as a tactical instrument rather than a set-and-forget exposure: define clear invalidation levels around intraday highs or recent daily lows, size positions modestly relative to account equity, and accept that volatility can be abrupt in both directions. Longer-term participants might be more interested in whether daily momentum and regime genuinely improve over the coming days, rather than reacting to every spike on the 15-minute chart.
For now, SHIB sits at a crossroads: intraday strength is undeniable, but until the daily trend structure turns, the burden of proof lies with the bulls.


You May Also Like

Powell’s inflation warning dampens rate cut expectations for June FOMC meeting: FT

Lawmaker Demands Polymarket Remove 219 War Bets After Airman Market Controversy – Bitcoin News


