

How to Build an Agent-Based Market Simulator
Table of Links
Abstract and 1. Introduction
2. Relevant Work
3. Methods
3.1 Models
3.2 Summarising Features
3.3 Calibration of Market Model Parameters
4. Experiments
4.1 Zero Intelligence Trader
4.2 Extended Chiarella
4.3 Historical Data
5. Discussion & Future Work
6. Significance, Acknowledgments, and References
3.1 Models
In this work, we use two different ABMs to test our calibration routine, the zero-intelligence trader model (ZI) and an extension to the Chiarella model. For further details on both, see [35] for the ZI model and [30] for the extended Chiarella. Future work will look at how this approach performs with other agent-based approaches to market simulation such as using the ABIDES framework [7].
\ 3.1.1 Zero Intelligence Trader. In order to simulate the exchange, we assume that trading is driven by a continuous double auction (CDA) between agents. At each timestep in the simulation, traders can place a limit order or market order in the exchange. Those orders that are not immediately executed are stored in the LOB, where queued limit orders can be cancelled at the beginning of each timestep. Submitted orders are processed sequentially, unmatched orders are queued on the LOB, while orders that can be matched are completely or partially filled. Expired orders are removed. This process is the same for both ZI and extended Chiarella model.
\ The ZI model includes, as 𝑁𝑎 agents, a set of zero intelligence traders who exhibit non-adaptive and stationary behaviours. These agents trade stochastically, submitting limit orders at each timestep with probability 𝛼 at a depth 𝐷 from the mid-price, market orders with probability 𝜇, where 𝛼 and 𝜇 are calculated as the average number of limit and market orders submitted per timestep, divided by the number of agents, 𝑁𝑎. Queued orders are cancelled with probability 𝛿 [35]. We note that choice of depth, 𝐷, is sampled from an exponential distribution from mid-price such that limit orders never cross the spread completely or result in a fill. The price at which the 𝑖 th limit order at time 𝑡 is submitted is then given by
\ 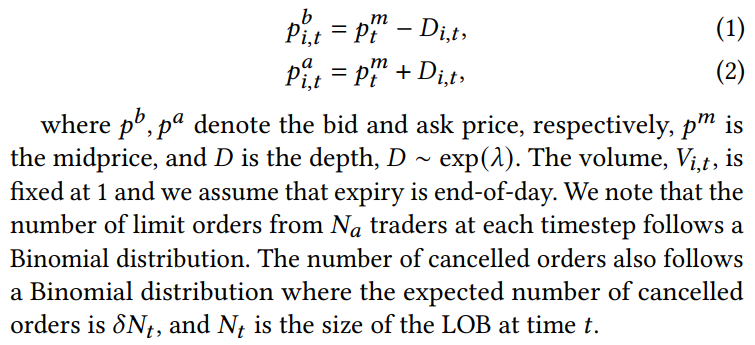
\ The ZI model provides a baseline to explore market behaviours and the fidelity of market simulation. This model can reproduce stylised facts observed in historical market data despite the relatively simple agent behaviours. However, it is also more constrained in the number of scenarios it is able to reproduce due to its simplicity. We next describe an extension to the Chiarella model which increases the complexity of trader behaviours.
\ 3.1.2 Extended Chiarella. The original Chiarella model increased the complexity of trader behaviours by introducing two broad trader classes, fundamentalists and chartists [10]. Fundamentalists trade based on rational expectations of the underlying fundamental value of the asset in question. On the other hand, chartists respond specifically to price trends such as the momentum of the asset price. This model has been further extended to include a third trader class, noise traders [30]. The agent behaviours and their relation to the underlying price are described in detail below.
\ We first assume that the price dynamics are described by a linear price-impact mechanism, as in [30],
\ 
\ where 𝛿𝑡 denotes simulation timestep, 𝜆 relates to the overall liquidity in the market and is a first-order approximation of market price sensitivity to demand and supply, also known as ‘Kyle’s lambda’, and 𝑑 (𝑡, 𝑡 + 𝛿𝑡) is the aggregated demand in the market due to the trading strategies of various market participants. These market participants are the three class of agents described above; fundamental, momentum (chartist) and noise traders.
\ Fundamental traders submit orders based on their perception of the underlying value of the asset, denoted by 𝑣𝑡 . Given this, they will tend to buy the asset when it is underpriced, namely when 𝑣𝑡 −𝑝𝑡 < 0 and sell the stock otherwise. We follow the convention in [10] that the aggregated demand of fundamental traders approximates the degree of mispricing within the market, which we denote by 𝜅. Hence, the aggregated demand for fundamental traders is given by
\ 
\ and where 𝑣𝑡 is a pre-assigned exogenous signal.
\ Momentum traders instead decide on the price at which to place an order according to the observed price dynamics in the exchange.
\ 
\ We assume that these traders follow a momentum strategy, i.e. the upward or downward trend of the asset, where we use an exponentially weighted moving average of past returns as the price trend signal. This trend signal is given by
\ 
\ where 𝛼𝑚 is the decay rate. We choose the demand function for momentum traders to be
\ 
\ where 𝛽 controls the overall demand generated by momentum traders, 𝛾𝑚 is the saturation of momentum trader demand for very large signals, and where we choose the demand function such that it is monotonic.
\ 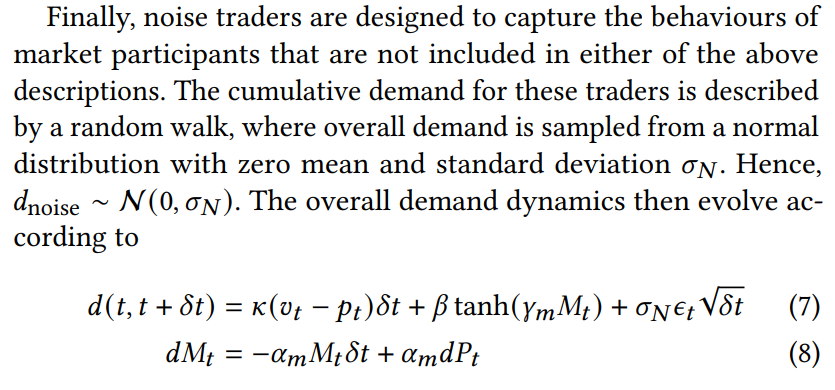
\ where 𝜖𝑡 follows a standard normal distribution and where the price dynamics are updated according to Equation 7.
\
:::info Authors:
(1) Namid R. Stillman, Simudyne Limited, United Kingdom ([email protected]);
(2) Rory Baggott, Simudyne Limited, United Kingdom ([email protected]);
(3) Justin Lyon, Simudyne Limited, United Kingdom ([email protected]);
(4) Jianfei Zhang, Hong Kong Exchanges and Clearing Limited, Hong Kong ([email protected]);
(5) Dingqiu Zhu, Hong Kong Exchanges and Clearing Limited, Hong Kong ([email protected]);
(6) Tao Chen, Hong Kong Exchanges and Clearing Limited, Hong Kong ([email protected]);
(7) Perukrishnen Vytelingum, Simudyne Limited, United Kingdom ([email protected]).
:::
:::info This paper is available on arxiv under CC BY 4.0 DEED license.
:::
\


You May Also Like

Tropical depression outside PAR intensifies into Tropical Storm Jangmi

Rappler Talk: Jinky Luistro on leading the prosecution vs Sara Duterte

US Bitcoin ETFs bleed $333.6 million as seven-day outflow streak deepens


