Aster price is forming a potential inverse head and shoulders pattern, signaling a possible trend reversal.Aster price is forming a potential inverse head and shoulders pattern, signaling a possible trend reversal.

Aster price forms inverse head and shoulders, $1.06 breakout target emerges

2026/03/05 00:20
3 min read
For feedback or concerns regarding this content, please contact us at [email protected]

Aster price is forming a potential inverse head and shoulders pattern, signaling a possible trend reversal. A confirmed breakout above $0.79 could trigger a bullish rally toward the $1.06 resistance target.

Summary
  • Inverse head and shoulders pattern forming
  • $0.79 neckline key breakout level
  • Breakout target projected near $1.06

Aster’s (ASTER) recent price action is beginning to show early signs of a structural reversal as a classic technical pattern emerges on the chart. After a prolonged corrective phase, the formation of an inverse head and shoulders pattern suggests that bullish momentum may be building beneath key resistance.

Aster price key technical points

  • Bullish Reversal Pattern: Inverse head and shoulders formation developing
  • Neckline Resistance: $0.79 acts as the key breakout level
  • Technical Target: Breakout projects a move toward $1.06 resistance
Aster price forms inverse head and shoulders, $1.06 breakout target emerges - 1

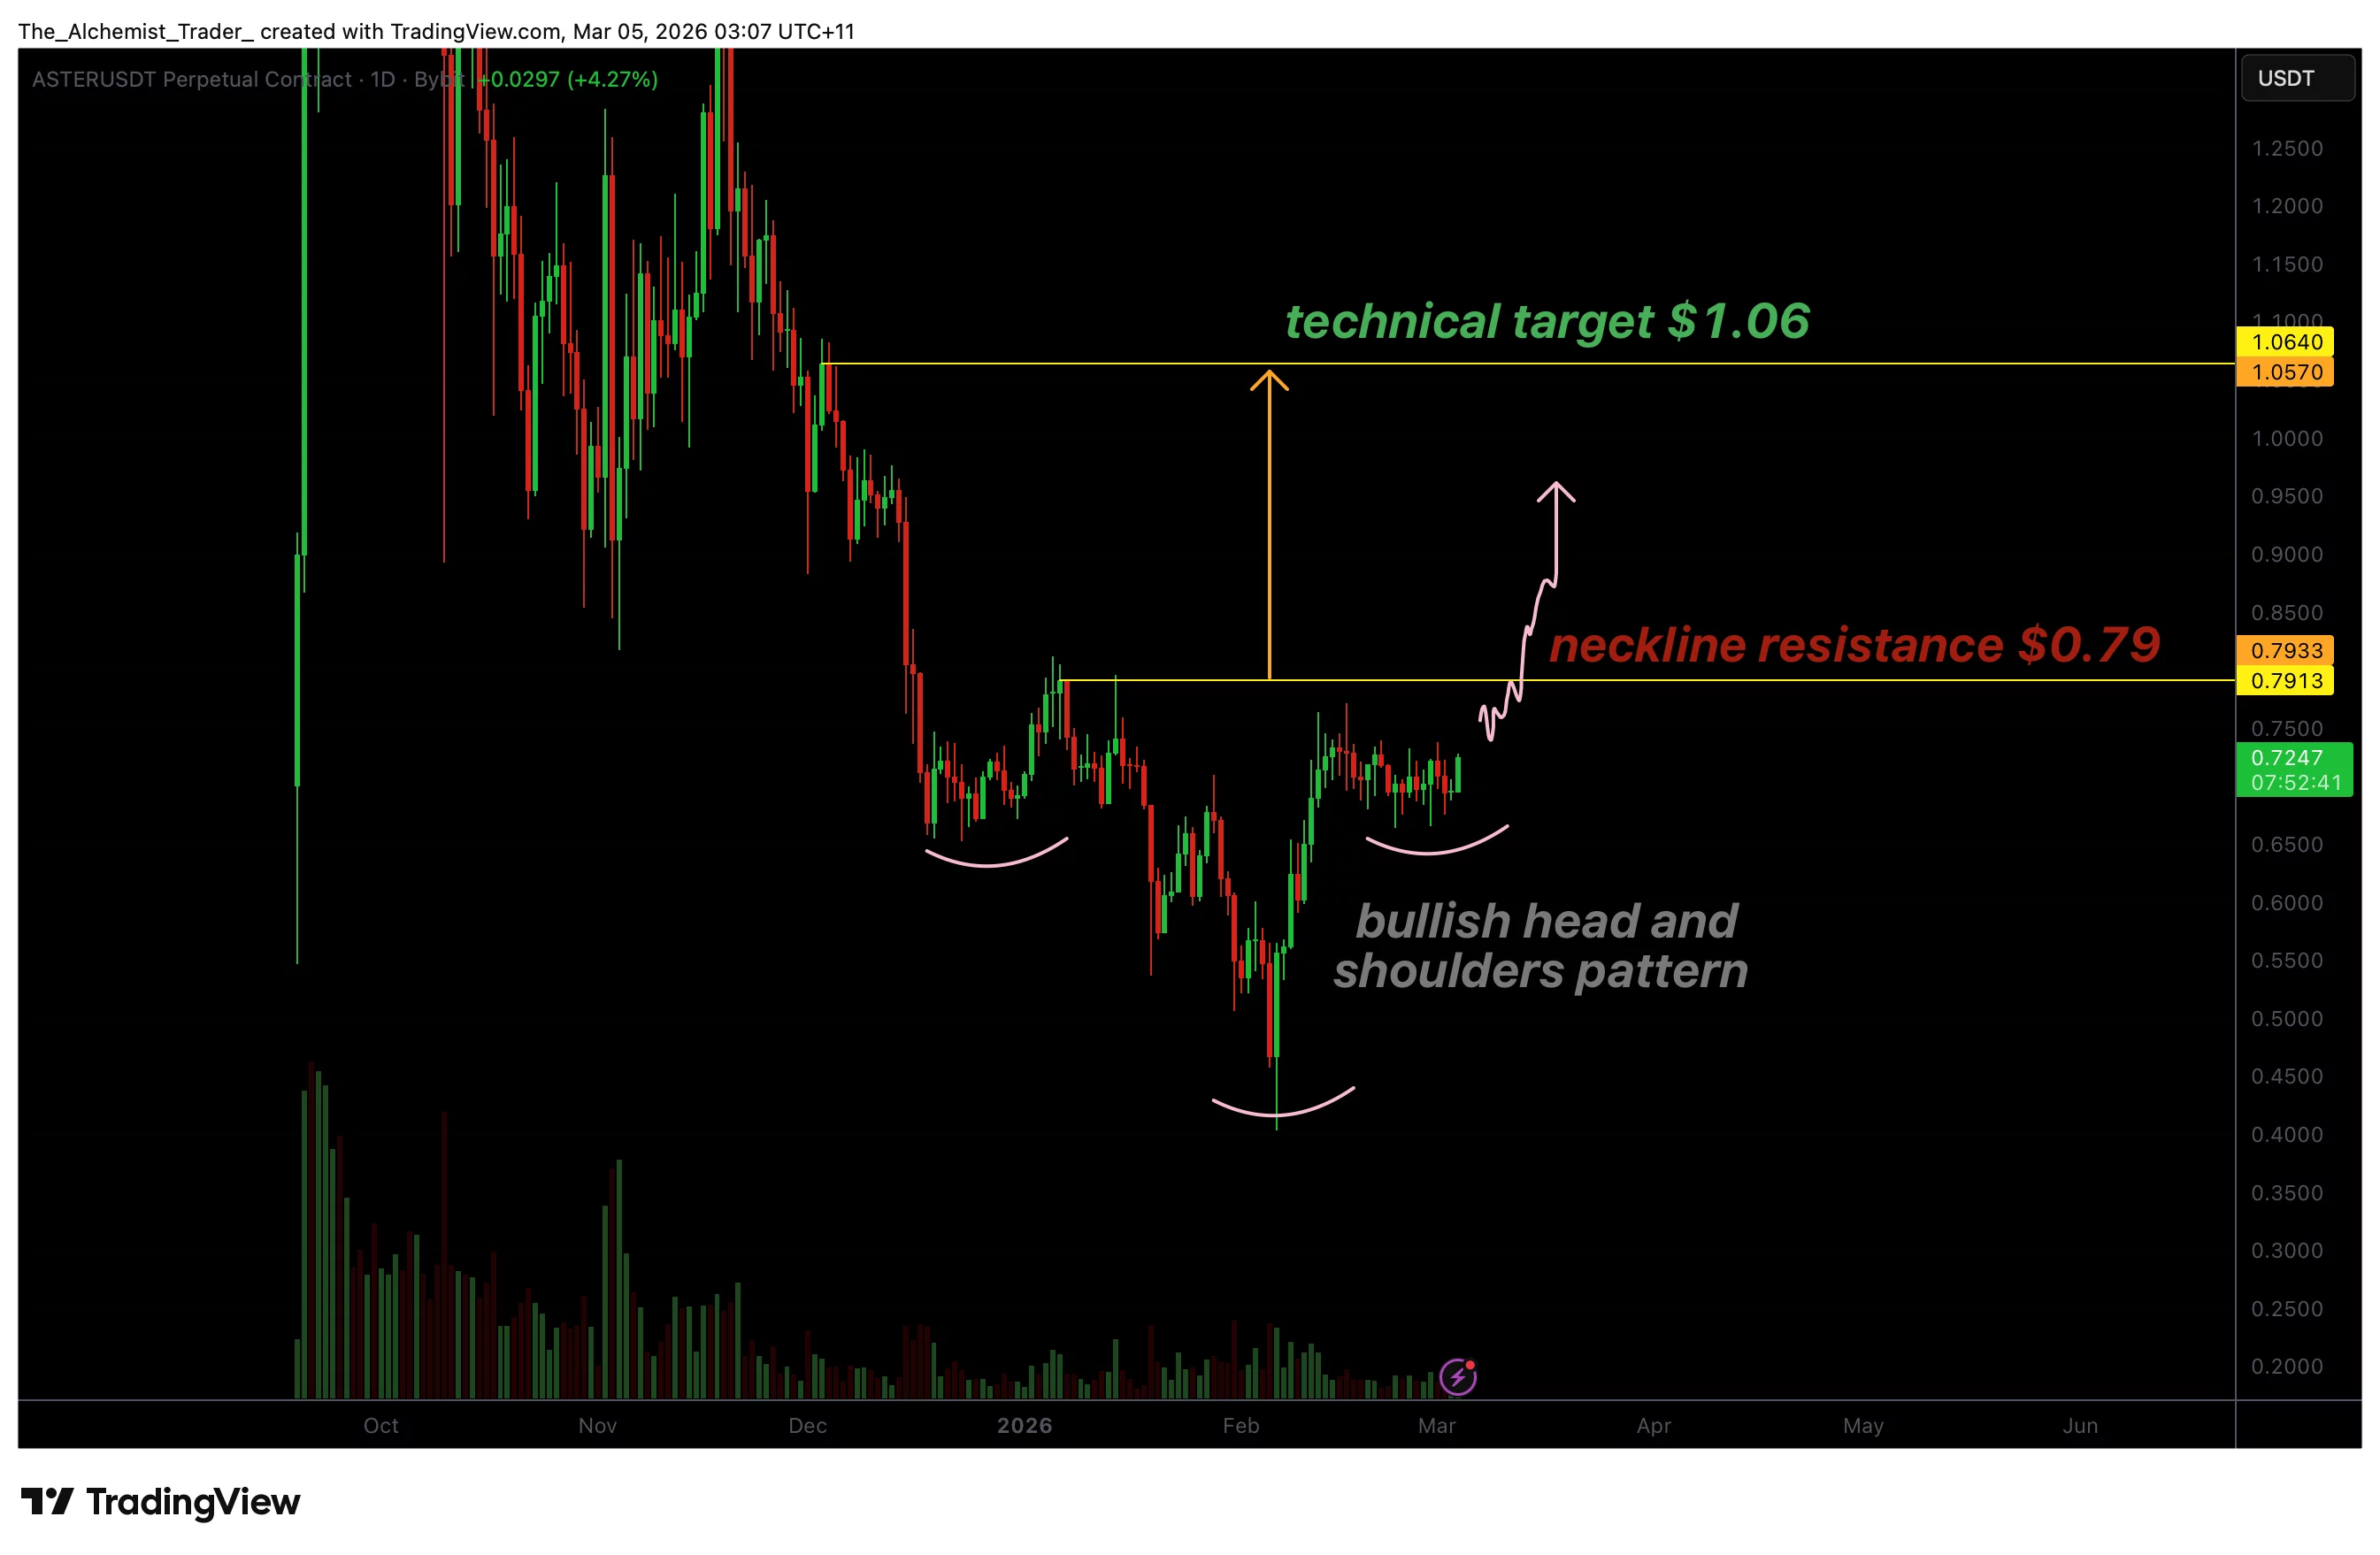
Aster’s current price structure closely resembles a classic inverse head and shoulders pattern, one of the most widely recognized bullish reversal formations in technical analysis. The chart shows a clear left shoulder, followed by a deeper head, and a developing right shoulder, indicating that selling pressure may gradually be weakening.

The defining feature of this formation is the neckline resistance, which in this case sits near the $0.79 level. Historically, this region has acted as a strong barrier for price action. Previous attempts to break above this zone resulted in bearish reactions, highlighting the presence of significant supply at this level.

However, repeated tests of resistance often weaken selling pressure over time. Each time the market approaches the neckline, sellers must absorb additional buying demand. Eventually, this process can lead to a decisive breakout if buying pressure becomes strong enough to overwhelm supply.

For the inverse head and shoulders pattern to activate, Aster must break and close above the $0.79 neckline. Confirmation of the breakout would indicate that buyers have regained control of market structure, potentially triggering a new bullish expansion phase.

Once confirmed, the technical target for the pattern sits near $1.06. This projection is calculated by measuring the distance from the head to the neckline and extending that range above the breakout point. Interestingly, this level also aligns with the next high timeframe resistance zone, adding further technical significance to the target.

Volume will play a crucial role in determining whether the breakout can succeed. Bullish continuation patterns typically require a noticeable increase in trading volume to confirm that market participation is expanding. Without strong volume support, breakouts can often fail and revert back into consolidation.

At the moment, the pattern remains unconfirmed, as price is still trading slightly below the neckline resistance. Until the $0.79 level is reclaimed on a closing basis, the inverse head and shoulders formation remains a developing setup rather than an activated signal.

From a market structure perspective, this consolidation beneath resistance may actually strengthen the potential breakout scenario. Prolonged compression below key levels often builds liquidity, which can lead to sharp expansion once the market resolves directionally.

If the breakout occurs with strong momentum, the path toward $1.06 could open quickly as short sellers are forced to cover positions and buyers chase the move higher.

What to expect in the coming price action

Aster is approaching a critical technical inflection point at $0.79. A confirmed breakout above this neckline with strong volume would activate the inverse head and shoulders pattern and project a rally toward the $1.06 resistance zone.

However, failure to break this level could keep price consolidating below resistance until sufficient momentum builds for a decisive move.

Market Opportunity
Aster Logo
Aster Price(ASTER)
$0.7173
$0.7173$0.7173
-1.38%
USD
Aster (ASTER) Live Price Chart
Disclaimer: The articles reposted on this site are sourced from public platforms and are provided for informational purposes only. They do not necessarily reflect the views of MEXC. All rights remain with the original authors. If you believe any content infringes on third-party rights, please contact [email protected] for removal. MEXC makes no guarantees regarding the accuracy, completeness, or timeliness of the content and is not responsible for any actions taken based on the information provided. The content does not constitute financial, legal, or other professional advice, nor should it be considered a recommendation or endorsement by MEXC.
Tags:

You May Also Like

CEO Sandeep Nailwal Shared Highlights About RWA on Polygon

CEO Sandeep Nailwal Shared Highlights About RWA on Polygon

The post CEO Sandeep Nailwal Shared Highlights About RWA on Polygon appeared on BitcoinEthereumNews.com. Polygon CEO Sandeep Nailwal highlighted Polygon’s lead in global bonds, Spiko US T-Bill, and Spiko Euro T-Bill. Polygon published an X post to share that its roadmap to GigaGas was still scaling. Sentiments around POL price were last seen to be bearish. Polygon CEO Sandeep Nailwal shared key pointers from the Dune and RWA.xyz report. These pertain to highlights about RWA on Polygon. Simultaneously, Polygon underlined its roadmap towards GigaGas. Sentiments around POL price were last seen fumbling under bearish emotions. Polygon CEO Sandeep Nailwal on Polygon RWA CEO Sandeep Nailwal highlighted three key points from the Dune and RWA.xyz report. The Chief Executive of Polygon maintained that Polygon PoS was hosting RWA TVL worth $1.13 billion across 269 assets plus 2,900 holders. Nailwal confirmed from the report that RWA was happening on Polygon. The Dune and https://t.co/W6WSFlHoQF report on RWA is out and it shows that RWA is happening on Polygon. Here are a few highlights: – Leading in Global Bonds: Polygon holds 62% share of tokenized global bonds (driven by Spiko’s euro MMF and Cashlink euro issues) – Spiko U.S.… — Sandeep | CEO, Polygon Foundation (※,※) (@sandeepnailwal) September 17, 2025 The X post published by Polygon CEO Sandeep Nailwal underlined that the ecosystem was leading in global bonds by holding a 62% share of tokenized global bonds. He further highlighted that Polygon was leading with Spiko US T-Bill at approximately 29% share of TVL along with Ethereum, adding that the ecosystem had more than 50% share in the number of holders. Finally, Sandeep highlighted from the report that there was a strong adoption for Spiko Euro T-Bill with 38% share of TVL. He added that 68% of returns were on Polygon across all the chains. Polygon Roadmap to GigaGas In a different update from Polygon, the community…
Share
BitcoinEthereumNews2025/09/18 01:10
BlackRock Increases U.S. Stock Exposure Amid AI Surge

BlackRock Increases U.S. Stock Exposure Amid AI Surge

The post BlackRock Increases U.S. Stock Exposure Amid AI Surge appeared on BitcoinEthereumNews.com. Key Points: BlackRock significantly increased U.S. stock exposure. AI sector driven gains boost S&P 500 to historic highs. Shift may set a precedent for other major asset managers. BlackRock, the largest asset manager, significantly increased U.S. stock and AI sector exposure, adjusting its $185 billion investment portfolios, according to a recent investment outlook report.. This strategic shift signals strong confidence in U.S. market growth, driven by AI and anticipated Federal Reserve moves, influencing significant fund flows into BlackRock’s ETFs. The reallocation increases U.S. stocks by 2% while reducing holdings in international developed markets. BlackRock’s move reflects confidence in the U.S. stock market’s trajectory, driven by robust earnings and the anticipation of Federal Reserve rate cuts. As a result, billions of dollars have flowed into BlackRock’s ETFs following the portfolio adjustment. “Our increased allocation to U.S. stocks, particularly in the AI sector, is a testament to our confidence in the growth potential of these technologies.” — Larry Fink, CEO, BlackRock The financial markets have responded favorably to this adjustment. The S&P 500 Index recently reached a historic high this year, supported by AI-driven investment enthusiasm. BlackRock’s decision aligns with widespread market speculation on the Federal Reserve’s next moves, further amplifying investor interest and confidence. AI Surge Propels S&P 500 to Historic Highs At no other time in history has the S&P 500 seen such dramatic gains driven by a single sector as the recent surge spurred by AI investments in 2023. Experts suggest that the strategic increase in U.S. stock exposure by BlackRock may set a precedent for other major asset managers. Historically, shifts of this magnitude have influenced broader market behaviors as others follow suit. Market analysts point to the favorable economic environment and technological advancements that are propelling the AI sector’s momentum. The continued growth of AI technologies is…
Share
BitcoinEthereumNews2025/09/18 02:49
Israel is losing close to $3 billion a week since fighting broke out with Iran, and markets are barely flinching

Israel is losing close to $3 billion a week since fighting broke out with Iran, and markets are barely flinching

Israel is losing close to $3 billion a week since fighting broke out with Iran, and markets are barely flinching. That figure comes from Israel’s Finance Ministry
Share
Cryptopolitan2026/03/05 05:20