The post Ordinals (ORDI) Price Prediction 2026, 2027-2030: Can ORDI Surge 100x Again? appeared first on Coinpedia Fintech News Story Highlights The live price ofThe post Ordinals (ORDI) Price Prediction 2026, 2027-2030: Can ORDI Surge 100x Again? appeared first on Coinpedia Fintech News Story Highlights The live price of

Ordinals (ORDI) Price Prediction 2026, 2027-2030: Can ORDI Surge 100x Again?

2026/03/05 14:43
7 min read
For feedback or concerns regarding this content, please contact us at [email protected]
Ordinals (ORDI) Price Prediction

The post Ordinals (ORDI) Price Prediction 2026, 2027-2030: Can ORDI Surge 100x Again? appeared first on Coinpedia Fintech News

Story Highlights

  • The live price of the Ordi token is  $ 2.52632154.
  • ORDI price is consolidating in the $1–$5 demand zone after a 95% drop from $95. A breakout above $5 could trigger a rally toward $10 and possibly $30 if market sentiment turns bullish.
  • Ordinals (ORDI) may be forming a bottom in 2026. If bulls reclaim $5 resistance, the token could target $8–$10 short term, with long-term forecasts reaching $60+ by 2030.

Ordinals allow users to engrave data onto Satoshis. These inscriptions act like NFTs, but without smart contracts. It’s working to be more precise; the ORDI tokens are the wallet’s native BRC-20 token inscribed onto satoshis, which users can securely store, transfer, or trade in the wallet’s built-in marketplace. Using this method offers a new form of digital value on Bitcoin.

ORDI isn’t just a token; it’s a milestone. The Ordinals protocol’s structure keeps it close to Bitcoin’s core while opening new use cases. All this happens on a non-custodial Ordinals wallet. As a result, it had a strong response in Q1 2024, spiking to around $95, but in Q1 2026, it’s over 95% down in a two-year span, showing complete consumption of its gains.

What’s coming next for the token? How high will ORDI price go? Can ORDI surge 100x? What will the price of ORDI be in 2030? Let’s explore the ORDI price prediction from 2026 to 2032.

ORDI Price Today

Cryptocurrency ORDI
Token ORDI
Price $2.5263 up 1.69%
Market Cap $ 53,052,752.41
24h Volume $ 17,156,439.9451
Circulating Supply 21,000,000.00
Total Supply 21,000,000.00
All-Time High $ 96.1744 on 05 March 2024
All-Time Low $ 1.4088 on 10 October 2025

Table of contents

  • Coinpedia’s Ordinals ORDI Price Prediction 2026
  • Ordinals ORDI Price Prediction March 2026
  • Ordinals (ORDI) Price Prediction 2026
  • Ordinals (ORDI) price prediction 2027-2032
    • Ordinals (ORDI) Price Prediction 2027
    • Ordinals Crypto Price Prediction 2028
    • ORDI Price Prediction 2029
    • Ordinals Price Prediction 2030
    • ORDI Coin Price Prediction 2031
    • Ordinals (ORDI) Price Prediction 2032
  • FAQs

Coinpedia’s Ordinals ORDI Price Prediction 2026

Ordinals (ORDI) is at a critical juncture in Q1 2026, consolidating in the $1.00 to $5.00 weekly demand zone, a key area that previously fueled a rally to $95.00. With potential “selling exhaustion,” breaking above $5.00 in the immediate term could lead to a rise toward $8.00 to $10.00. If market sentiment shifts positively, the 2026 target may reach $30.00; otherwise, consolidation may continue.

Ordinals ORDI Price Prediction March 2026

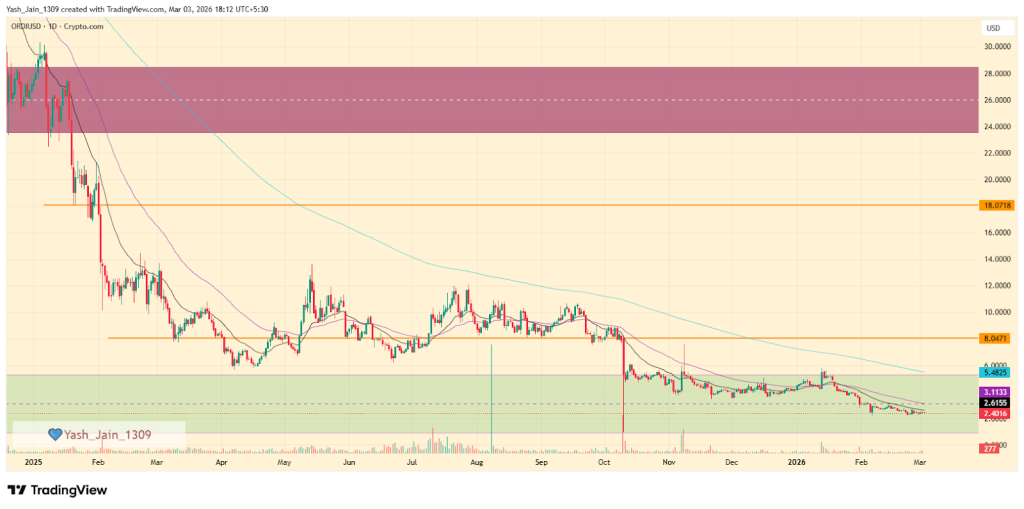
The daily chart for ORDI price reveals a persistent lack of buyer interest, as muted momentum continues to dominate price action. This downward trajectory was accelerated in early 2025 when a massive flush by bears transformed the $24.00 – $28.00 range into a formidable supply zone.

Technical weakness intensified throughout late 2025 as neither the $18.00 psychological level nor the $8.00 structural support could halt the decline. The loss of $8.00 in October was a critical turning point; since then, selling pressure has remained relentless, with the price consistently rejected by the dynamic resistance of the 20-day and 50-day EMA bands.

As of Q1 2026, the sharp sell-offs in January and February have pushed ORDI to multi-year lows, leaving investor sentiment in a state of elevated fear.

If ORDI loses its footing at the current $2.00 level, a further slip toward the $1.00 psychological support becomes highly probable.

Conversely, if a relief rally ignites in March, the primary objective for bulls will be a retest of the $5.00 resistance. Reclaiming this level is essential to breaking the cycle of lower highs and shifting market perception.

ORDI Price

Ordinals (ORDI) Price Prediction 2026

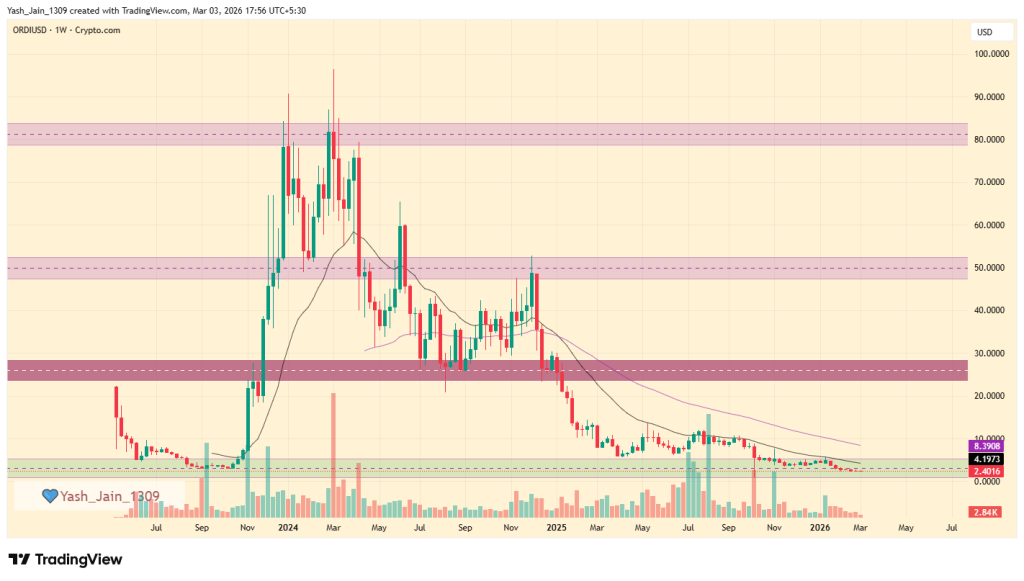
The weekly chart for Ordinals (ORDI) highlights a critical technical juncture as we move through the first quarter of 2026. After a prolonged period of bearish dominance, the price has returned to the very foundation of its historical market structure.

The 2026 Bottoming Pattern? ORDI is currently undergoing a significant consolidation phase within the $1.00 to $5.00 demand zone. This accumulation range is of paramount importance; it is the exact same launchpad that ignited the legendary late-2023 rally, where the asset surged from a low of $2.75 to a staggering peak of $95.00, delivering gains exceeding 3,300%.

Following that historic high, the past two years have seen a consistent downtrend. However, the Q1 2026 return to this primary demand area suggests that the “selling exhaustion” phase may be nearing completion.

Moreover, the immediate focus for bulls is a decisive breakout above the $5.00 level from resistance to support, which is the primary requirement for a short-term trend reversal.

Once $5.00 is reclaimed, the path clears for a swift move toward the $8.00 to $10.00 liquidity pocket.

Macro Target: Should broader market sentiment shift to “risk-on,” the explosive nature of the Ordinals protocol could drive the 2026 recovery target to $30.00, representing substantial odds of recovery from current accumulation levels. But if it doesn’t happen, then consolidation in this demand area may stretch.

Ordinals ORDI Price Prediction 2026

Ordinals (ORDI) price prediction 2027-2032

Year Minimum Price ($) Maximum Price ($) Average Price ($)
2027 6.40 27.60 16.50
2028 19.10 40.90 29.50
2029 23.00 55.75 33.50
2030 38.50 62.50 49.00
2031 47.00 72.00 57.90
2032 57.50 85.90 68.50

Ordinals (ORDI) Price Prediction 2027

The outlook for 2027 suggests a substantial expansion in market valuation. ORDI is expected to trade within a wide range of $6.40 to $27.60, maintaining a healthy average price of $16.50 as it consolidates its position in the Bitcoin ecosystem.

Ordinals Crypto Price Prediction 2028

Building on the momentum of the previous year, 2028 could see ORDI breaking into new territory. Projections indicate a minimum price of $19.10 and a potential peak of $40.90, with an anticipated average trading cost of $29.50.

ORDI Price Prediction 2029

By 2029, the maturation of BRC-20 utility is expected to drive prices further. The token is projected to range between $23.00 and $55.75, resulting in a yearly average of approximately $33.50.

Ordinals Price Prediction 2030

Entering the new decade, Ordinals is forecast to show significant strength. Analysis suggests a price floor of $38.50 and a maximum surge toward $62.50, with investors looking at an average price of $49.00.

ORDI Coin Price Prediction 2031

The upward trajectory is expected to intensify in 2031. The highest projected price for the year reaches $72.00, while the minimum is expected to hold firm at $47.00, averaging out to $57.90.

Ordinals (ORDI) Price Prediction 2032

Looking toward 2032, the Ordinals protocol estimates a continued bullish trend. ORDI is expected to fluctuate between $57.50 and $85.90, with an average market price of $68.50.

Never Miss a Beat in the Crypto World!

Stay ahead with breaking news, expert analysis, and real-time updates on the latest trends in Bitcoin, altcoins, DeFi, NFTs, and more.

bell icon Subscribe to Price Prediction

FAQs

What is Ordinals (ORDI) in crypto?

Ordinals (ORDI) is the first BRC-20 token built on Bitcoin using the Ordinals protocol, allowing data to be inscribed on satoshis and traded like digital assets.

What is the ORDI price prediction for 2026?

ORDI could trade between $1 and $30 in 2026. A breakout above the key $5 resistance may trigger recovery momentum toward the $8–$10 range.

How much will ORDI coin be worth in 2030?

By 2030, ORDI could trade between $38 and $62, with an estimated average near $49, if adoption of Bitcoin Ordinals and BRC-20 tokens continues to grow.

What factors could drive ORDI price growth?

ORDI growth may depend on Bitcoin ecosystem adoption, BRC-20 token usage, NFT demand on Bitcoin, and overall crypto market sentiment.

Can ORDI reach $100 again?

Reaching $100 would require strong adoption of Bitcoin Ordinals and a major market cycle. While possible long-term, it depends on demand and ecosystem growth.

Market Opportunity
ORDI Logo
ORDI Price(ORDI)
$2.502
$2.502$2.502
-4.06%
USD
ORDI (ORDI) Live Price Chart
Disclaimer: The articles reposted on this site are sourced from public platforms and are provided for informational purposes only. They do not necessarily reflect the views of MEXC. All rights remain with the original authors. If you believe any content infringes on third-party rights, please contact [email protected] for removal. MEXC makes no guarantees regarding the accuracy, completeness, or timeliness of the content and is not responsible for any actions taken based on the information provided. The content does not constitute financial, legal, or other professional advice, nor should it be considered a recommendation or endorsement by MEXC.

You May Also Like

X money beta expands with 6% yield and cashback in beta

X money beta expands with 6% yield and cashback in beta

The post X money beta expands with 6% yield and cashback in beta appeared on BitcoinEthereumNews.com. This week, Elon Musk moved another step toward his vision
Share
BitcoinEthereumNews2026/03/05 20:55
Crucial US Stock Market Update: What Wednesday’s Mixed Close Reveals

Crucial US Stock Market Update: What Wednesday’s Mixed Close Reveals

BitcoinWorld Crucial US Stock Market Update: What Wednesday’s Mixed Close Reveals The financial world often keeps us on our toes, and Wednesday was no exception. Investors watched closely as the US stock market concluded the day with a mixed performance across its major indexes. This snapshot offers a crucial glimpse into current investor sentiment and economic undercurrents, prompting many to ask: what exactly happened? Understanding the Latest US Stock Market Movements On Wednesday, the closing bell brought a varied picture for the US stock market. While some indexes celebrated gains, others registered slight declines, creating a truly mixed bag for investors. The Dow Jones Industrial Average showed resilience, climbing by a notable 0.57%. This positive movement suggests strength in some of the larger, more established companies. Conversely, the S&P 500, a broader benchmark often seen as a barometer for the overall market, experienced a modest dip of 0.1%. The technology-heavy Nasdaq Composite also saw a slight retreat, sliding by 0.33%. This particular index often reflects investor sentiment towards growth stocks and the tech sector. These divergent outcomes highlight the complex dynamics currently at play within the American economy. It’s not simply a matter of “up” or “down” for the entire US stock market; rather, it’s a nuanced landscape where different sectors and company types are responding to unique pressures and opportunities. Why Did the US Stock Market See Mixed Results? When the US stock market delivers a mixed performance, it often points to a tug-of-war between various economic factors. Several elements could have contributed to Wednesday’s varied closings. For instance, positive corporate earnings reports from certain industries might have bolstered the Dow. At the same time, concerns over inflation, interest rate policies by the Federal Reserve, or even global economic uncertainties could have pressured growth stocks, affecting the S&P 500 and Nasdaq. Key considerations often include: Economic Data: Recent reports on employment, manufacturing, or consumer spending can sway market sentiment. Corporate Announcements: Strong or weak earnings forecasts from influential companies can significantly impact their respective sectors. Interest Rate Expectations: The prospect of higher or lower interest rates directly influences borrowing costs for businesses and consumer spending, affecting future profitability. Geopolitical Events: Global tensions or trade policies can introduce uncertainty, causing investors to become more cautious. Understanding these underlying drivers is crucial for anyone trying to make sense of daily market fluctuations in the US stock market. Navigating Volatility in the US Stock Market A mixed close, while not a dramatic downturn, serves as a reminder that market volatility is a constant companion for investors. For those involved in the US stock market, particularly individuals managing their portfolios, these days underscore the importance of a well-thought-out strategy. It’s important not to react impulsively to daily movements. Instead, consider these actionable insights: Diversification: Spreading investments across different sectors and asset classes can help mitigate risk when one area underperforms. Long-Term Perspective: Focusing on long-term financial goals rather than short-term gains can help weather daily market swings. Stay Informed: Keeping abreast of economic news and company fundamentals provides context for market behavior. Consult Experts: Financial advisors can offer personalized guidance based on individual risk tolerance and objectives. Even small movements in major indexes can signal shifts that require attention, guiding future investment decisions within the dynamic US stock market. What’s Next for the US Stock Market? Looking ahead, investors will be keenly watching for further economic indicators and corporate announcements to gauge the direction of the US stock market. Upcoming inflation data, statements from the Federal Reserve, and quarterly earnings reports will likely provide more clarity. The interplay of these factors will continue to shape investor confidence and, consequently, the performance of the Dow, S&P 500, and Nasdaq. Remaining informed and adaptive will be key to understanding the market’s trajectory. Conclusion: Wednesday’s mixed close in the US stock market highlights the intricate balance of forces influencing financial markets. While the Dow showed strength, the S&P 500 and Nasdaq experienced slight declines, reflecting a nuanced economic landscape. This reminds us that understanding the ‘why’ behind these movements is as important as the movements themselves. As always, a thoughtful, informed approach remains the best strategy for navigating the complexities of the market. Frequently Asked Questions (FAQs) Q1: What does a “mixed close” mean for the US stock market? A1: A mixed close indicates that while some major stock indexes advanced, others declined. It suggests that different sectors or types of companies within the US stock market are experiencing varying influences, rather than a uniform market movement. Q2: Which major indexes were affected on Wednesday? A2: On Wednesday, the Dow Jones Industrial Average gained 0.57%, while the S&P 500 edged down 0.1%, and the Nasdaq Composite slid 0.33%, illustrating the mixed performance across the US stock market. Q3: What factors contribute to a mixed stock market performance? A3: Mixed performances in the US stock market can be influenced by various factors, including specific corporate earnings, economic data releases, shifts in interest rate expectations, and broader geopolitical events that affect different market segments uniquely. Q4: How should investors react to mixed market signals? A4: Investors are generally advised to maintain a long-term perspective, diversify their portfolios, stay informed about economic news, and avoid impulsive decisions. Consulting a financial advisor can also provide personalized guidance for navigating the US stock market. Q5: What indicators should investors watch for future US stock market trends? A5: Key indicators to watch include upcoming inflation reports, statements from the Federal Reserve regarding monetary policy, and quarterly corporate earnings reports. These will offer insights into the future direction of the US stock market. Did you find this analysis of the US stock market helpful? Share this article with your network on social media to help others understand the nuances of current financial trends! To learn more about the latest stock market trends, explore our article on key developments shaping the US stock market‘s future performance. This post Crucial US Stock Market Update: What Wednesday’s Mixed Close Reveals first appeared on BitcoinWorld.
Share
Coinstats2025/09/18 05:30
Surge Reload or Downside Drift Ahead?

Surge Reload or Downside Drift Ahead?

The post Surge Reload or Downside Drift Ahead? appeared on BitcoinEthereumNews.com. Pump.fun is hovering at the $0.0020 mark. PUMP’s trading volume has soared by
Share
BitcoinEthereumNews2026/03/05 21:25