

From Bear Trap to Breakout? Ethereum (ETH) Tests a Crucial Momentum Shift After a 7% Jump
- Ethereum price has gained over 7%, trading at $2.1K.
- The ETH market has seen a $155.29 million liquidation.
A 4.96% bullish surge in the crypto market has lifted the digital assets up to their recent highs. With the Fear and Greed Index value at 29, the fear sentiment is lingering. The largest asset, Bitcoin (BTC), has climbed to $72K, and the largest altcoin, Ethereum (ETH), has gained by over 7.51% in value in the last 24 hours.
ETH has traded at a low of $1,963 in the early hours. With the bulls taking control, the price has jumped to a high of $2,198. If this recovery persisted, the asset would see more gains. Ethereum traded at $2,114, with its trading volume soaring by 40.16% to $33.39 billion. Also, the ETH market has seen a liquidation of $155.29 million.
The trading pattern of Ethereum unveils a bullish trend, and the price might climb to the resistance at the $2.2K level. Upon breaking further on the upside, the bulls would trigger the emergence of the golden cross, and gradually send the asset’s price higher.
If the bears entered the Ethereum market, the immediate support level might be found at around $2K. With the downside correction gaining more traction, the death cross could take place. The potential bears may drive the price even lower to its recent lows.
Bullish Momentum Builds for Ethereum as Indicators Turn Positive
Ethereum’s Moving Average Convergence Divergence line is above the signal line, indicating strong bullish momentum. The recent price strength is running ahead of its usual average. As long as the MACD remains above, the bullish structure is likely to continue.
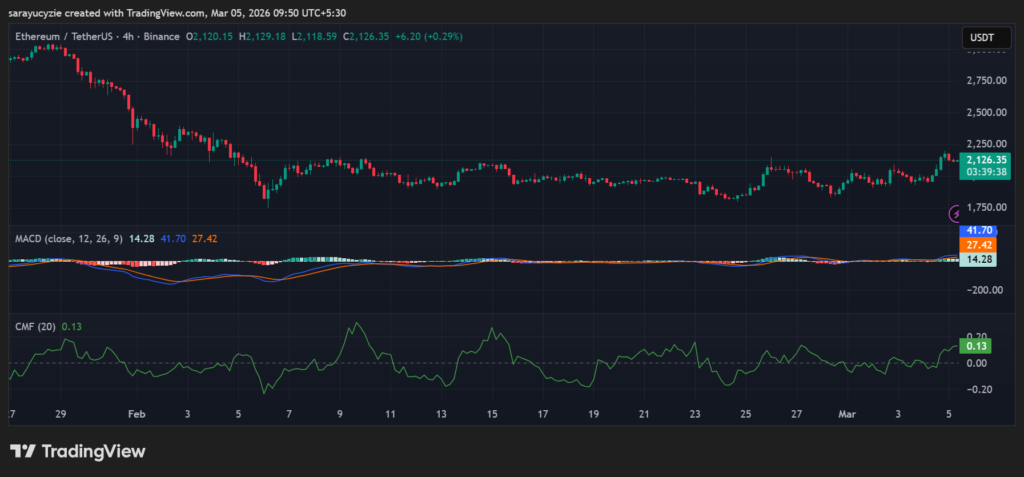 ETH chart (Source: TradingView)
Besides, the Chaikin Money Flow (CMF), which assesses the capital flow into the asset, is found at 0.13, suggesting moderate buying pressure. Notably, it is attracting a steady inflow of capital. With accumulation taking place for ETH, buyers are more active than sellers.
The daily Relative Strength Index (RSI) at 63.12 implies a modest but strong bullish sentiment, with the buyers maintaining control of the trend. Ethereum has more room on the upside, and if it continues moving to 70, bullish momentum could strengthen further.
Moreover, ETH’s Bull Bear Power (BBP) value of 117.90 hints at strong bullish dominance. The price is trading above its average level, reflecting a powerful uptrend and strong buying interest. Significantly, this might signal overextended conditions.
Top Updated Crypto News
AI Cryptocurrencies as Nvidia Decides to End Investments in OpenAI and Anthropic


You May Also Like

Solana (SOL) Price Is Down, But the Network Is Way Ahead – Here’s Why

Bitcoin World Reveals Top 5 Stunning Gainers And Losers


