The post Sei (SEI) Price Prediction 2026, 2027-2030: Will the Sei Giga Upgrade Trigger a Bullish Breakout? appeared first on Coinpedia Fintech News Story HighlightsThe post Sei (SEI) Price Prediction 2026, 2027-2030: Will the Sei Giga Upgrade Trigger a Bullish Breakout? appeared first on Coinpedia Fintech News Story Highlights

Sei (SEI) Price Prediction 2026, 2027-2030: Will the Sei Giga Upgrade Trigger a Bullish Breakout?

2026/03/05 18:53
7 min read
For feedback or concerns regarding this content, please contact us at [email protected]
SEI Price Prediction 2026,2027 – 2032

The post Sei (SEI) Price Prediction 2026, 2027-2030: Will the Sei Giga Upgrade Trigger a Bullish Breakout? appeared first on Coinpedia Fintech News

Story Highlights

  • The SEI live Price is  $ 0.06890115.
  • Sei (SEI) remains in a bearish trend in 2026, with price approaching the $0.020 demand zone. A strong rebound could push SEI back toward $0.10–$0.20 by year-end.
  • Long-term projections remain bullish for Sei, with analysts forecasting steady growth that could push SEI toward the $1.26–$1.45 range by 2032.

Originally recognized as the first sector-specific Layer 1 blockchain, Sei has evolved into a powerhouse of parallelized execution. While its initial mission focused on optimizing decentralized exchanges (DEXs), the 2024-2025 “V2” upgrade transformed Sei into the Parallelized EVM. This pivot allowed the network to combine the vast developer ecosystem of Ethereum with the blazing-fast performance typically reserved for non-EVM chains like Solana.

As we move through 2026, the network is undergoing its most ambitious technical overhaul yet: the Sei Giga upgrade. By implementing the “Autobahn” consensus and asynchronous execution, Sei aims to support over 200,000 transactions per second with sub-400ms finality. From institutional real-world asset (RWA) tokenization to high-frequency gaming and AI-agent economies.

Planning on investing in this crypto project but concerned about its prospects? Fear not and scroll down, as in this article, we have uncovered the market trends of SEI price prediction from 2026 up until 2032.

Sei Price Today

Cryptocurrency Sei
Token SEI
Price $0.0689 up 0.42%
Market Cap $ 463,934,395.74
24h Volume $ 53,086,659.7462
Circulating Supply 6,733,333,333.00
Total Supply 10,000,000,000.00
All-Time High $ 1.1417 on 16 March 2024
All-Time Low $ 0.0080 on 15 August 2023

Table of contents

  • Coinpedia’s Sei (SEI) Price Prediction 2026
  • Sei (SEI) Price Prediction March 2026
    • Recent News/Updates
  • Sei (SEI) Price Prediction 2026
  • Sei (SEI) Long-Term Price Projections: 2027 – 2032
    • Sei (SEI) Price Prediction 2027
    • Sei Crypto Price Prediction 2028
    • SEI Token Price Prediction 2029
    • SEI Price Prediction 2030
    • SEI/USD Prediction 2031
    • Sei (SEI) Price Prediction 2032
  • FAQs

Coinpedia’s Sei (SEI) Price Prediction 2026

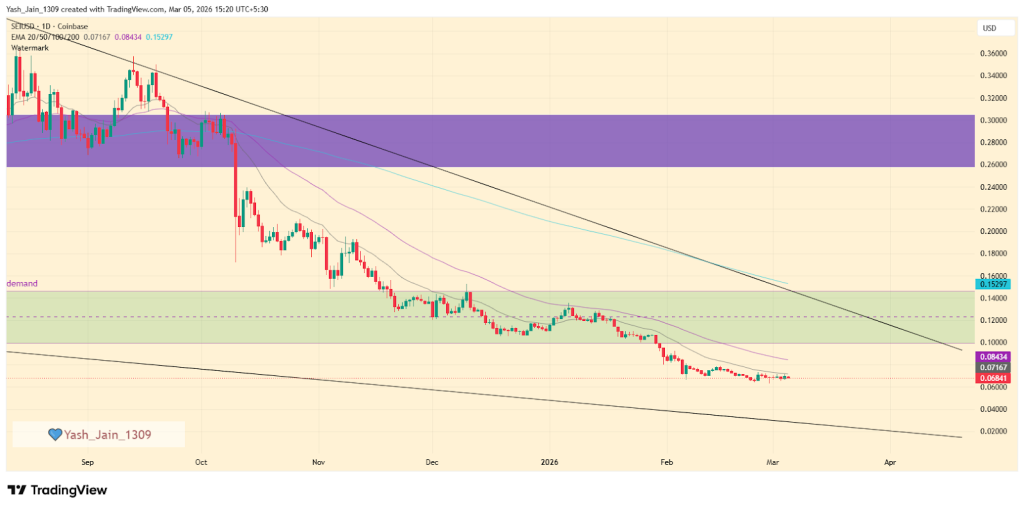
The 2026 outlook for Sei (SEI) shows a persistent downtrend and Q1 failed to hold the $0.10 support and is now in a falling wedge pattern. Currently, it’s approaching the $0.020 demand zone, where a potential reversal could lead prices back to $0.10 or $0.20. A bullish scenario might see even a retest of $0.30 by year-end.

Sei (SEI) Price Prediction March 2026

In January, the SEI price dropped below the $0.100 support level and reached a low of $0.064 in late February. As we continue through March, there is a possibility that the SEI price could decline further to the $0.040 and $0.020 levels if it fails to maintain the $0.060-$0.064 support range on the daily chart. However, if it manages to hold this support area, March could see a recovery back to the $0.10 – $0.12 range, where the lower and upper borders of the long-term falling wedge pattern align.

Sei (SEI) Price Prediction March 2026

Recent News/Updates

  • Sumvin, Inc. officially launched on February 26, 2026, utilizing Sei’s sub-second finality for AI-powered financial execution.
  • Coinbase Markets announced on February 27th that Sei will transition from Cosmos-based transactions to an EVM-only architecture. They will be facilitating this migration to the Sei EVM, which will take place from April 6-8, 2026.

Sei (SEI) Price Prediction 2026

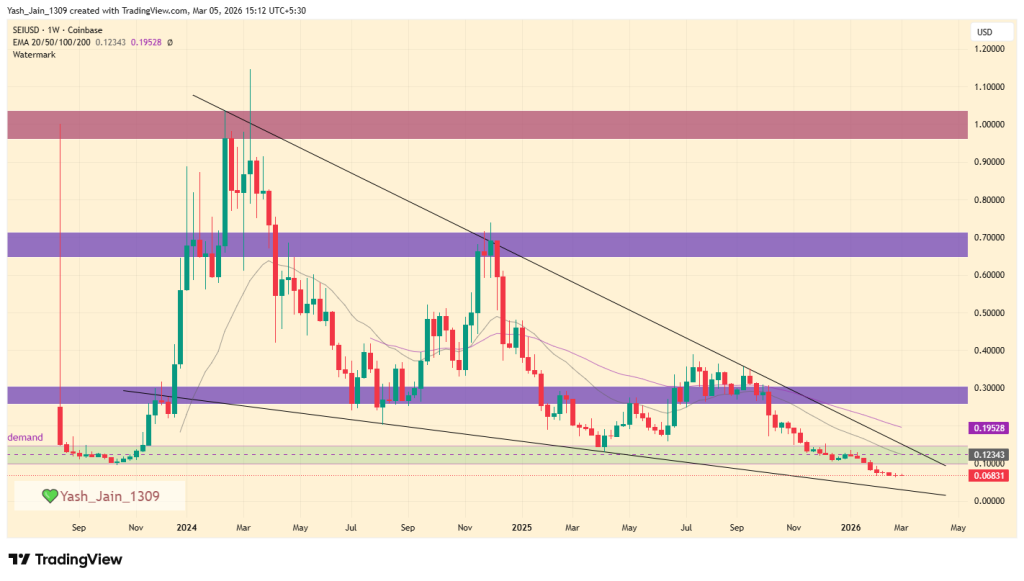
The technical outlook for Sei (SEI) in 2026 reflects a challenging macroeconomic trend defined by a persistent descending structure. Looking back at the weekly chart, 2024 was marked by two significant but ultimately capped rallies: an explosive surge to the $1.00 mark in the early months, followed by a secondary peak near $0.70 late in the year 2024. Both movements highlighted intense bearish pressure, as sellers consistently utilized these rallies to exit positions, effectively constraining the price within a tightening range.

This market structure deteriorated further in 2025 when the SEI price failed to hold the critical $0.30 demand zone. The breakdown confirmed that the SEI asset had abandoned traditional horizontal support levels and is favoring a massive falling wedge pattern. 

This technical formation has been dictated by three clear resistance touches, the most recent occurring in September 2025. While analysts initially hoped the early 2023 demand floor would exhaust the selling pressure, the first quarter of 2026 saw a continuation of the slide, with the price slipping beneath the psychological $0.10 support area.

Current price action suggests that the SEI price is now gravitating toward the lower boundary of the falling wedge. This decline is expected to persist through mid-2026 until the price meets the primary demand area situated around the $0.020 mark. This level represents a deep value zone where selling exhaustion is highly probable.

If buyers successfully defend this floor, the resulting spike in demand could ignite a trend reversal, potentially driving the SEI token price back toward the $0.10 and $0.20 levels. Under a highly bullish recovery scenario, a retest of the $0.30 breakdown point remains a possibility before the year concludes.

Sei (SEI) Price Prediction 2026

Sei (SEI) Long-Term Price Projections: 2027 – 2032

Year Minimum Price ($) Maximum Price ($) Average Price ($)
2027 0.2450 0.2940 0.2500
2028 0.3550 0.4260 0.3650
2029 0.5240 0.6190 0.5350
2030 0.7850 0.9050 0.8060
2031 0.8900 1.1000 0.9950
2032 1.2600 1.4500 1.3210

Sei (SEI) Price Prediction 2027

The SEI price forecast maintains an upward climb throughout 2027. Market analysts project the SEI token will fluctuate between $0.2450 and $0.2940, centering on an annual average SEI/USD price of $0.2500.

Sei Crypto Price Prediction 2028

Growth is expected to accelerate in 2028 as ecosystem maturity attracts deeper liquidity. SEI crypto price is projected to trade within a bullish corridor of $0.3550 to $0.4260, maintaining a robust year-round average of $0.3650.

SEI Token Price Prediction 2029

By 2029, SEI token’s price movements are anticipated to reach a significant peak of $0.6190. On the lower end, strong support is expected at $0.5240, leading to a projected average trading cost of $0.5350.

SEI Price Prediction 2030

Entering the new decade, SEI Crypto’s valuation is expected to be driven by global market recognition. Projections suggest a price range of $0.7850 to $0.9050, with an expected average price of $0.8060.

SEI/USD Prediction 2031

The bullish momentum continues into 2031, with the high target set at $1.1000. While retracements may dip toward $0.8900, the overall market equilibrium is expected to sit near $0.9950.

Sei (SEI) Price Prediction 2032

Based on current expert modeling, 2032 represents a major milestone for the token. SEI is estimated to range between $1.2600 and $1.4500, with an average valuation of $1.3210.

Never Miss a Beat in the Crypto World!

Stay ahead with breaking news, expert analysis, and real-time updates on the latest trends in Bitcoin, altcoins, DeFi, NFTs, and more.

bell icon Subscribe to Price Prediction

FAQs

What will the SEI price be in 2026?

Analysts expect SEI to trade between $0.02 and $0.30 in 2026. A rebound from the $0.02 demand zone could push the token back toward $0.10–$0.20 if buying momentum returns.

What is the SEI price prediction for 2027?

Market forecasts suggest SEI may trade between $0.245 and $0.294 in 2027, with an average price near $0.25 as adoption and ecosystem growth continue.

What is the Sei Coin price prediction for 2030?

Market projections suggest SEI may trade between $0.78 and $0.90 by 2030, with an average around $0.80, assuming steady adoption and favorable crypto market trends.

What Is Sei crypto price prediction for 2040?

If adoption continues to grow, long-term projections suggest SEI could potentially exceed $3–$5 by 2040, driven by institutional use, DeFi expansion, and network upgrades.

Is SEI a good investment for long term?

SEI shows strong long-term potential due to its high-speed blockchain, EVM compatibility, and DeFi ecosystem, but investors should still consider crypto market risks.

Market Opportunity
SEI Logo
SEI Price(SEI)
$0.06793
$0.06793$0.06793
-4.53%
USD
SEI (SEI) Live Price Chart
Disclaimer: The articles reposted on this site are sourced from public platforms and are provided for informational purposes only. They do not necessarily reflect the views of MEXC. All rights remain with the original authors. If you believe any content infringes on third-party rights, please contact [email protected] for removal. MEXC makes no guarantees regarding the accuracy, completeness, or timeliness of the content and is not responsible for any actions taken based on the information provided. The content does not constitute financial, legal, or other professional advice, nor should it be considered a recommendation or endorsement by MEXC.

You May Also Like

X money beta expands with 6% yield and cashback in beta

X money beta expands with 6% yield and cashback in beta

The post X money beta expands with 6% yield and cashback in beta appeared on BitcoinEthereumNews.com. This week, Elon Musk moved another step toward his vision
Share
BitcoinEthereumNews2026/03/05 20:55
Crucial US Stock Market Update: What Wednesday’s Mixed Close Reveals

Crucial US Stock Market Update: What Wednesday’s Mixed Close Reveals

BitcoinWorld Crucial US Stock Market Update: What Wednesday’s Mixed Close Reveals The financial world often keeps us on our toes, and Wednesday was no exception. Investors watched closely as the US stock market concluded the day with a mixed performance across its major indexes. This snapshot offers a crucial glimpse into current investor sentiment and economic undercurrents, prompting many to ask: what exactly happened? Understanding the Latest US Stock Market Movements On Wednesday, the closing bell brought a varied picture for the US stock market. While some indexes celebrated gains, others registered slight declines, creating a truly mixed bag for investors. The Dow Jones Industrial Average showed resilience, climbing by a notable 0.57%. This positive movement suggests strength in some of the larger, more established companies. Conversely, the S&P 500, a broader benchmark often seen as a barometer for the overall market, experienced a modest dip of 0.1%. The technology-heavy Nasdaq Composite also saw a slight retreat, sliding by 0.33%. This particular index often reflects investor sentiment towards growth stocks and the tech sector. These divergent outcomes highlight the complex dynamics currently at play within the American economy. It’s not simply a matter of “up” or “down” for the entire US stock market; rather, it’s a nuanced landscape where different sectors and company types are responding to unique pressures and opportunities. Why Did the US Stock Market See Mixed Results? When the US stock market delivers a mixed performance, it often points to a tug-of-war between various economic factors. Several elements could have contributed to Wednesday’s varied closings. For instance, positive corporate earnings reports from certain industries might have bolstered the Dow. At the same time, concerns over inflation, interest rate policies by the Federal Reserve, or even global economic uncertainties could have pressured growth stocks, affecting the S&P 500 and Nasdaq. Key considerations often include: Economic Data: Recent reports on employment, manufacturing, or consumer spending can sway market sentiment. Corporate Announcements: Strong or weak earnings forecasts from influential companies can significantly impact their respective sectors. Interest Rate Expectations: The prospect of higher or lower interest rates directly influences borrowing costs for businesses and consumer spending, affecting future profitability. Geopolitical Events: Global tensions or trade policies can introduce uncertainty, causing investors to become more cautious. Understanding these underlying drivers is crucial for anyone trying to make sense of daily market fluctuations in the US stock market. Navigating Volatility in the US Stock Market A mixed close, while not a dramatic downturn, serves as a reminder that market volatility is a constant companion for investors. For those involved in the US stock market, particularly individuals managing their portfolios, these days underscore the importance of a well-thought-out strategy. It’s important not to react impulsively to daily movements. Instead, consider these actionable insights: Diversification: Spreading investments across different sectors and asset classes can help mitigate risk when one area underperforms. Long-Term Perspective: Focusing on long-term financial goals rather than short-term gains can help weather daily market swings. Stay Informed: Keeping abreast of economic news and company fundamentals provides context for market behavior. Consult Experts: Financial advisors can offer personalized guidance based on individual risk tolerance and objectives. Even small movements in major indexes can signal shifts that require attention, guiding future investment decisions within the dynamic US stock market. What’s Next for the US Stock Market? Looking ahead, investors will be keenly watching for further economic indicators and corporate announcements to gauge the direction of the US stock market. Upcoming inflation data, statements from the Federal Reserve, and quarterly earnings reports will likely provide more clarity. The interplay of these factors will continue to shape investor confidence and, consequently, the performance of the Dow, S&P 500, and Nasdaq. Remaining informed and adaptive will be key to understanding the market’s trajectory. Conclusion: Wednesday’s mixed close in the US stock market highlights the intricate balance of forces influencing financial markets. While the Dow showed strength, the S&P 500 and Nasdaq experienced slight declines, reflecting a nuanced economic landscape. This reminds us that understanding the ‘why’ behind these movements is as important as the movements themselves. As always, a thoughtful, informed approach remains the best strategy for navigating the complexities of the market. Frequently Asked Questions (FAQs) Q1: What does a “mixed close” mean for the US stock market? A1: A mixed close indicates that while some major stock indexes advanced, others declined. It suggests that different sectors or types of companies within the US stock market are experiencing varying influences, rather than a uniform market movement. Q2: Which major indexes were affected on Wednesday? A2: On Wednesday, the Dow Jones Industrial Average gained 0.57%, while the S&P 500 edged down 0.1%, and the Nasdaq Composite slid 0.33%, illustrating the mixed performance across the US stock market. Q3: What factors contribute to a mixed stock market performance? A3: Mixed performances in the US stock market can be influenced by various factors, including specific corporate earnings, economic data releases, shifts in interest rate expectations, and broader geopolitical events that affect different market segments uniquely. Q4: How should investors react to mixed market signals? A4: Investors are generally advised to maintain a long-term perspective, diversify their portfolios, stay informed about economic news, and avoid impulsive decisions. Consulting a financial advisor can also provide personalized guidance for navigating the US stock market. Q5: What indicators should investors watch for future US stock market trends? A5: Key indicators to watch include upcoming inflation reports, statements from the Federal Reserve regarding monetary policy, and quarterly corporate earnings reports. These will offer insights into the future direction of the US stock market. Did you find this analysis of the US stock market helpful? Share this article with your network on social media to help others understand the nuances of current financial trends! To learn more about the latest stock market trends, explore our article on key developments shaping the US stock market‘s future performance. This post Crucial US Stock Market Update: What Wednesday’s Mixed Close Reveals first appeared on BitcoinWorld.
Share
Coinstats2025/09/18 05:30
Surge Reload or Downside Drift Ahead?

Surge Reload or Downside Drift Ahead?

The post Surge Reload or Downside Drift Ahead? appeared on BitcoinEthereumNews.com. Pump.fun is hovering at the $0.0020 mark. PUMP’s trading volume has soared by
Share
BitcoinEthereumNews2026/03/05 21:25