

Dogecoin Price Prediction: DOGE Accumulation Cycles Hint at Move to $0.15
Key Insights:
- Dogecoin price is inside a symmetrical triangle, and the major support is at $0.08.
- Historical accumulation cycles imply that DOGE could follow past trends and extend to $0.15.
- A confirmed breakout above the triangle resistance may trigger renewed momentum, pushing DOGE to $0.15.
Dogecoin price is in a critical stage as various technical setups are clustering around important support zones. According to market analysts, compression patterns and accumulation cycles are forming simultaneously across multiple timeframes.
Dogecoin price prediction is aligned to these structures, and analysts are pointing at a possible breakout to the $0.15 mark should resistance be cleared.
Triangle Signals Dogecoin Price Prediction Breakout
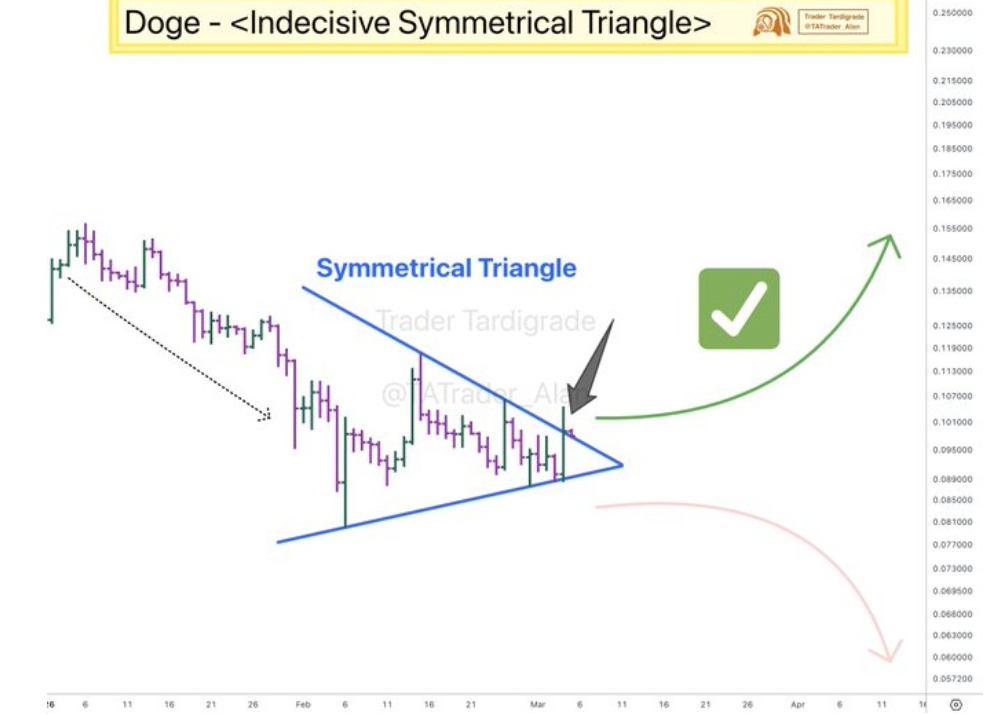
According to Tardigrade, DOGE price is now in a symmetrical triangle on the daily timeframe. The trend was formed following a long-term decline where Dogecoin recorded successive lower lows.
Price action has now shifted to the narrowing stage of consolidation, characterized by falling resistance and rising support.
 DOGEUSD 1D CHART | SOURCE: X
The triangle’s top remains a strong level of resistance. A series of lower highs has been strengthened by numerous attempts to rally to this descending trendline, being rejected.
In the meantime, the rising support line indicates continuous buying at steadily rising prices. This formation suggests that bearish pressure may be weakening as demand slowly absorbs available supply.
Additionally, the analyst suggested that a confirmed breakout above the triangle resistance could be the catalyst for a quick volatility increase. The graph shows a projected path to the zone of $0.15 when compression reverses to an upward direction.
These breakouts usually release built-up liquidity when sidelined traders enter the market. This action forms an important component of the current Dogecoin price prediction outlook.
However, the pattern remains neutral until a confirmed breakout happens. Instead, the structure might break downwards if DOGE price does not clear the downside resistance.
Any drop below the rising support may reveal lower levels towards a $0.06. Dogecoin’s price stays locked in consolidation as it edges closer to the triangle’s apex. Traders wait for a breakout to confirm the next major move. Momentum will shift only once a clear directional push occurs.
Will DOGE Price Rally Next?
Meanwhile, market analyst Bitcoinsensus focused on Dogecoin’s repeating accumulation cycles. The chart identifies several historical consolidation zones that preceded major price expansions.
Each cycle began with sideways accumulation before transitioning into a strong upward rally. These structures provide historical context for the current Dogecoin price prediction.
 DOGEUSD PRICE CHART | SOURCE: X
Most importantly, the initial accumulation period took place in 2023. Dogecoin price increased by almost 190% after a long consolidation.
Another powerful rally that later followed in the second phase of accumulation was above 480%. These past trends indicate that the asset has cycles of movement.
According to the analysis, the market could be in an accumulation stage at the moment.
This stage demonstrates DOGE price action stabilization in a rectangular consolidation after a steep fall from previous highs. The lateral activity in such zones may represent the accumulation of positions by long-term investors.
$0.08 Support Shapes Dogecoin Price Prediction
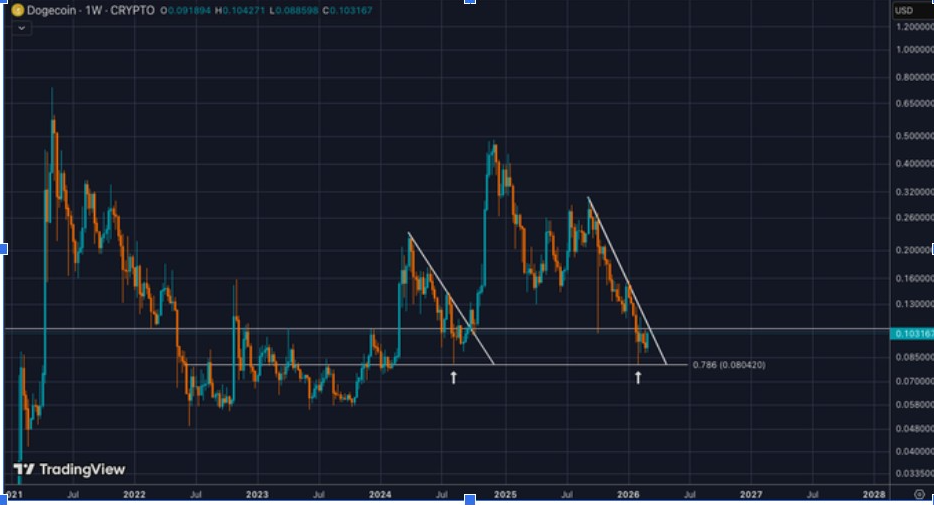
Surf analyzes the weekly chart with Fibonacci retracement levels. The 0.786 retracement around $0.08 has been pointed out as the crucial macro support zone. Historically, the level is a deep correction zone with strong demand during bullish cycles.
 DOGEUSD 1W CHART | SOURCE: X
Dogecoin price, as seen on the chart, has repeatedly tested the $0.08 zone after hitting the last market peak.
Every engagement with such a level of support has yielded significant price responses. The responses show that buyers are still active at this level, making it a significant aspect of the overall market structure.
In addition, the weekly chart shows a downward resistance trendline forming lower highs. Such a structure indicates a corrective phase that occurred after the last bull market rally.
The market is under downward pressure. However, the repeated defense of the $0.08 zone shows underlying accumulation in the long-term trend.
Past tests of the same support had strong upward reversals. The chart identified some of the moments when DOGE price recovered after it hit the bottom of the structure.
This $0.08 level remains crucial for Dogecoin’s price outlook. If the price holds above it, a new recovery phase can unfold.
The post Dogecoin Price Prediction: DOGE Accumulation Cycles Hint at Move to $0.15 appeared first on The Market Periodical.


You May Also Like

BSP ‘considering’ off-cycle rate hike as inflation risks worsen

Bitcoin Bull Michael Saylor Cited Two Reasons Why Bitcoin Isn’t Rallying

Solana treasury firm Solmate raises $11.4M in premium stock offering


