Another profit strategy in the Meme market is to increase returns by being a passive LP
Author: @jackmelnick_ , Head of DeFi at Berachain
Compiled by: Felix, PANews
I wrote a post about LP costs 8 months ago, which didn’t attract much attention at the time, but the number of views on the post tripled yesterday, so this article re-validates this method with the latest examples.
Prerequisite: In order for this method to work better, you need to deploy memecoin as early as possible, recognize that a certain memecoin has certain advantages in the medium and long term, and the trading volume must be large. The example in this article uses the BUCK token.
As mentioned in the previous post , you need to set a v3 range with the lower end of the range slightly lower than the current price of the token (usually about 25% lower) and the upper end of the range relatively high (about 100 BUCK/SOL or about $2.5/BUCK is chosen in this example). This setting minimizes the amount of SOL you have to deposit with LP, and as the price rises, DCA (Constant Amount Contribution) will gradually allow you to transfer from memecoin to SOL.
Let's talk about impermanent loss (IL): Here is @AbishekFi's statement:
IL is a tool, not a loss … Measuring LP returns is a hot topic, but it really depends on your preference as an LP . Do you want asset A or asset B ? Or would you rather your position be worth more?
The only way this could happen is if one / both assets in your token pair appreciate in value, resulting in impermanent loss. However, if you LP on two assets you don’t mind holding , then you’ve just created an on-chain DCA that also generates fees . ”
As @shawmakesmagic mentioned, this could be a very valuable tool for token developers, especially for AI agents with ongoing costs. Providing v3 scoped liquidity for a token pair allows developers to use fees to profit/pay fees while participating in token appreciation. It will directly adjust value in the long term (depending on how the scope is set).
To prove that this approach is effective, let’s look at a simple BUCK example, which the author divides into initial reserves, ongoing impermanent loss, incurred expenses, and return on investment.
A BUCK/SOL LP was created yesterday, offering 17 SOL and 892,000 BUCK. The reason for this is that the Gamestop campaign has broad appeal, fast token rotation, and extremely high volatility and trading volume.
The range is set from an upper limit of 100 BUCK/SOL (about $2.5) to a lower limit of 8,500 BUCK/SOL (about $0.029), which is about 20% lower than the market price of about 6,900 BUCK/SOL, ensuring that the token pair will not fall out of the range if BUCK falls in the short term.
This represents a total value of approximately $4,000 in SOL and $30,000 in BUCK (relevant for calculating impermanent loss later).
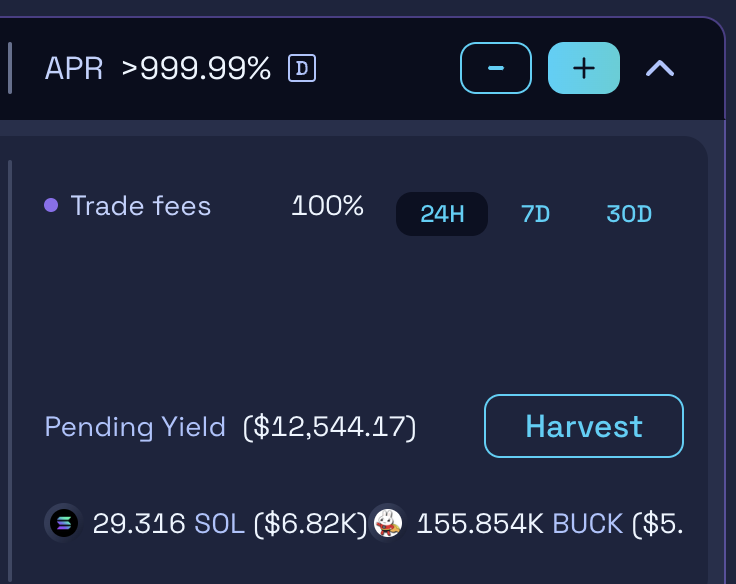
After 10 hours the LP was extracted, which yielded:
- 29.3 SOL and 156,000 BUCK (fees)
- 25.1 SOL and 841,456 BUCK (LP)
$12,500 in fees in 10 hours on a $34,000 deposit is roughly 88% of the daily fees. This is an absolutely incredible number, even without compounding, the APY is 32,120%.
The impermanent loss in this case is a loss of about 50,000 BUCK tokens, which are replaced by an additional 8 SOL, which is negligible from the perspective of impermanent loss.
To make it clearer:
- Deposit (Total) = 17 SOL and 892,000 BUCK
- Withdrawal (Total) = 54.4 SOL and 997,000 BUCK
- Total profit of LP = 37.4 SOL and 105,000 BUCK
It is clear that the impermanent loss generated by the pool is more than offset by the fees generated by the trading volume. This is optimized in token pairs that keep prices roughly consistent with extremely high trading volumes.
Even crazier, this can be optimized further:
- Adjusted LP fee tier from 1% to 2% due to deeper liquidity and higher trading volume
- Tighten the upper limit of the initial range to further concentrate liquidity, and rebalance the range over time if prices rise
- If you want to avoid a fall after the token has risen (no round trip trading), you can pull your LP and rebalance the lower limit of the range to 20% of the current floor price again, thereby pocketing your DCAed SOL.
In the meme market, where trading volatility is extremely high and price sensitivity is extremely low, positioning yourself as a passive LP is an excellent strategy to maximize returns, especially for token pairs with longer holding periods and larger trading volumes, and taking into account users who are not sure whether to hold SOL or meme.
Related reading: In-depth discussion of two DEX mechanisms: How to solve LP’s profit risk?


You May Also Like

WLFI Moves to End Indefinite Token Lock with Four-Year Vesting Proposal

What Texas Roadhouse Teaches You About Real Leadership