

MSTR Stock Price Forecast as Saylor Hints at Another Bitcoin Buy
Key Insights
- MSTR stock price is at risk of a big drop this week.
- Michael Saylor hinted that the company continued buying Bitcoin last week.
- Bitcoin may drop as crude oil surges amid the ongoing war in Iran.
MSTR stock price has dropped by 15% this year, and this trend may continue as Bitcoin remains under pressure amid the ongoing war in Iran. Strategy ended last week at $133, down substantially from its all-time high of $545.
Michael Saylor Hints Strategy is Still Buying Bitcoin
In an X post, Saylor hinted that the company continued accumulating Bitcoin last week. He sent an X post noting that the second century had began, meaning that it had bought Bitcoin for the 101st time.
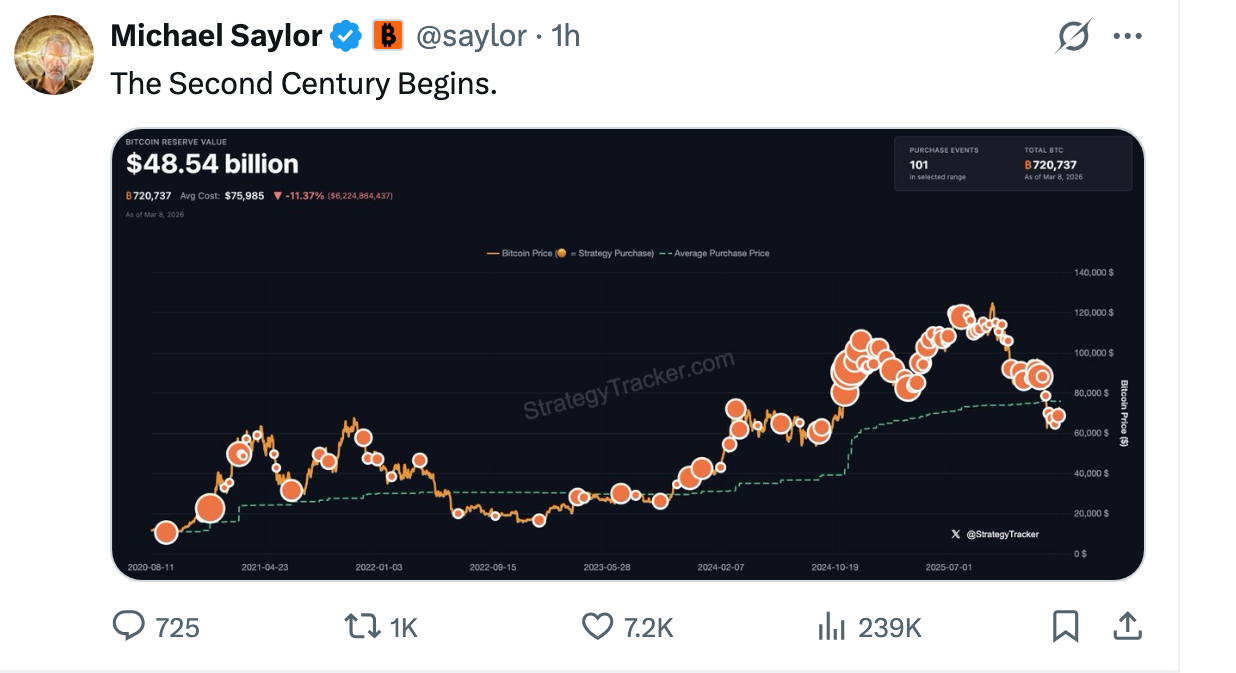 Michael Saylor X post on Bitcoin purchases | Source: X
Strategy now holds 720,737 coins, currently worth over $48 billion. Its last purchase was reported on Monday last week, when the company said it bought 3,015 coins worth over $54 million.
The company has access to cash to continue its dollar-cost averaging (DCA). Data from its SEC filings show that the company has access to $1.6 billion from its STRF preferred shares, $3.535 billion from its STRC, and $20 billion from its STRK. It also has access to $4 billion in STRD and $7’6 billion in its common shares. It also has over $2 billion in cash on its balance sheet, which it can use to accumulate its coins.
The risk, however, is the company is sitting on huge unrealized losses as its average cost per Bitcoin is $75,992, much higher than the current $67,000. Its loss since it began accumulating Bitcoin has jumped to 11.72%.
Another risk is that its shareholders have been diluted over the past few years, with total outstanding shares soaring to 314 million from 75 million a few years ago.
Bitcoin Price at Risk as Crude Oil Jumps
A major risk facing the MSTR stock is that Bitcoin could be headed lower as geopolitical risks rise. For example, Hyperliquid data shows that the West Texas Intermediate (WTI) oil benchmark has jumped to $116. It closed at $90 on Friday.
Other crude oil benchmarks available during the weekend, including those from the Middle East, have soared above $100.
Rising oil price is a sign that traders expect the war in Iran to continue for longer. Indeed, Polymarket data shows that the probability of a ceasefire occurring soon has continued to fall.
Bitcoin’s price often rises when energy prices are falling, as lower energy prices lead to lower inflation, which in turn pushes the Federal Reserve to cut interest rates.
There is a possibility that oil and gas prices will continue to rise this month, pushing inflation higher and making it harder for the Federal Reserve to cut interest rates this year.
Data from Kalshi shows that market participants expect the Federal Reserve to deliver just one interest rate cut this year.
A sharp decline in Bitcoin’s price will be bearish for Strategy, as its business is mostly valued based on its Bitcoin holdings.
Technical analysis suggests that BTC price may continue falling this week. As the chart below shows, Bitcoin has formed a head-and-shoulders pattern on the weekly chart.
It has also dropped below the crucial support level at $74,714, its lowest level in April last year. Therefore, the coin will likely continue falling, potentially to the key support level at $60,000 and below.
 BTC price chart | Source: TradingView
MSTR Stock Chart Analysis Points to More Downside
Similarly, the weekly chart shows that the Strategy stock price is at risk of a deep dive in the near term. It has already moved below the key support level at $230, the neckline of the double-top pattern.

MSTR stock price chart | Source: TradingView
The stock has also formed a bearish pennant pattern. This pattern is made up of two parts: a flagpole and a symmetrical triangle. It is now in the final section and is at risk for falling to the key support level at $100.
The post MSTR Stock Price Forecast as Saylor Hints at Another Bitcoin Buy appeared first on The Market Periodical.


You May Also Like

BoE: Tokenisation Could Cut Costs as UK Advances Stablecoin Rules

COMP Price Jumps 10% As Yale Summit Buzz Fuels Momentum


