Hyperliquid price eyes $40 breakout as technical indicators turn bullish
Hyperliquid price is pushing toward a key resistance zone as rising trading volume and strengthening technical signals point to growing bullish momentum in the market.
- Hyperliquid rose to around $32 in a possible recovery attempt towards $40..
- Volume and open interest climbed, indicating new positions as traders anticipate further price movement.
- Technical indicators show strengthening momentum, with resistance sitting between $33 and $36.
Hyperliquid (HYPE) edged higher on renewed buying, with the token trading around $32.63 at press time, up 6.6% in the past 24 hours. The price has stayed within a weekly range of $29.61 to $33.33, holding near the top of that band.
Over the past year, Hyperliquid has been one of the stronger performers among the top 100 cryptocurrencies, gaining about 136%. Even so, it still trades roughly 45% below its September 2025 peak of $59.30.
Trading activity has picked up as well. 24-hour spot volume reached about $289 million, a 98% increase compared with the previous day, which suggests fresh interest from traders.
Derivatives markets show a similar pattern. Data from CoinGlass shows trading volume climbing 84% to $1.36 billion, while open interest rose 9.56% to $1.33 billion. This mix open often signals that new positions are being added rather than closed.
Hyperliquid fundamentals grow stronger
Beyond price action, the platform itself continues to expand. Hyperliquid now accounts for roughly 70% of decentralized perpetual futures trading volume, while daily activity on the exchange is estimated at 9.9% of the level seen on Binance.
The network has also built a sizable user base. More than 665,000 traders are active on the platform, and monthly revenue is estimated at around $116 million. According to project data, about 38% of the token supply has been set aside for future ecosystem initiatives.
New features are gradually being introduced. These include HIP-4 outcome trading and efforts to connect real-world assets to the platform.
Supply mechanics may also play a role in the token’s dynamics. Hyperliquid runs an assistance fund that periodically buys back and burns HYPE tokens. Roughly 4.17% of the supply, valued at about $1.36 billion, has already been removed through these operations, reducing the number of tokens in circulation.
Hyperliquid price technical analysis
From a technical perspective, several signals have started to lean positive. The price currently sits above the mid-Bollinger Band, which corresponds to the 20-day moving average. That area, around $29 to $30, has been acting as support in recent weeks as buyers step in during pullbacks.
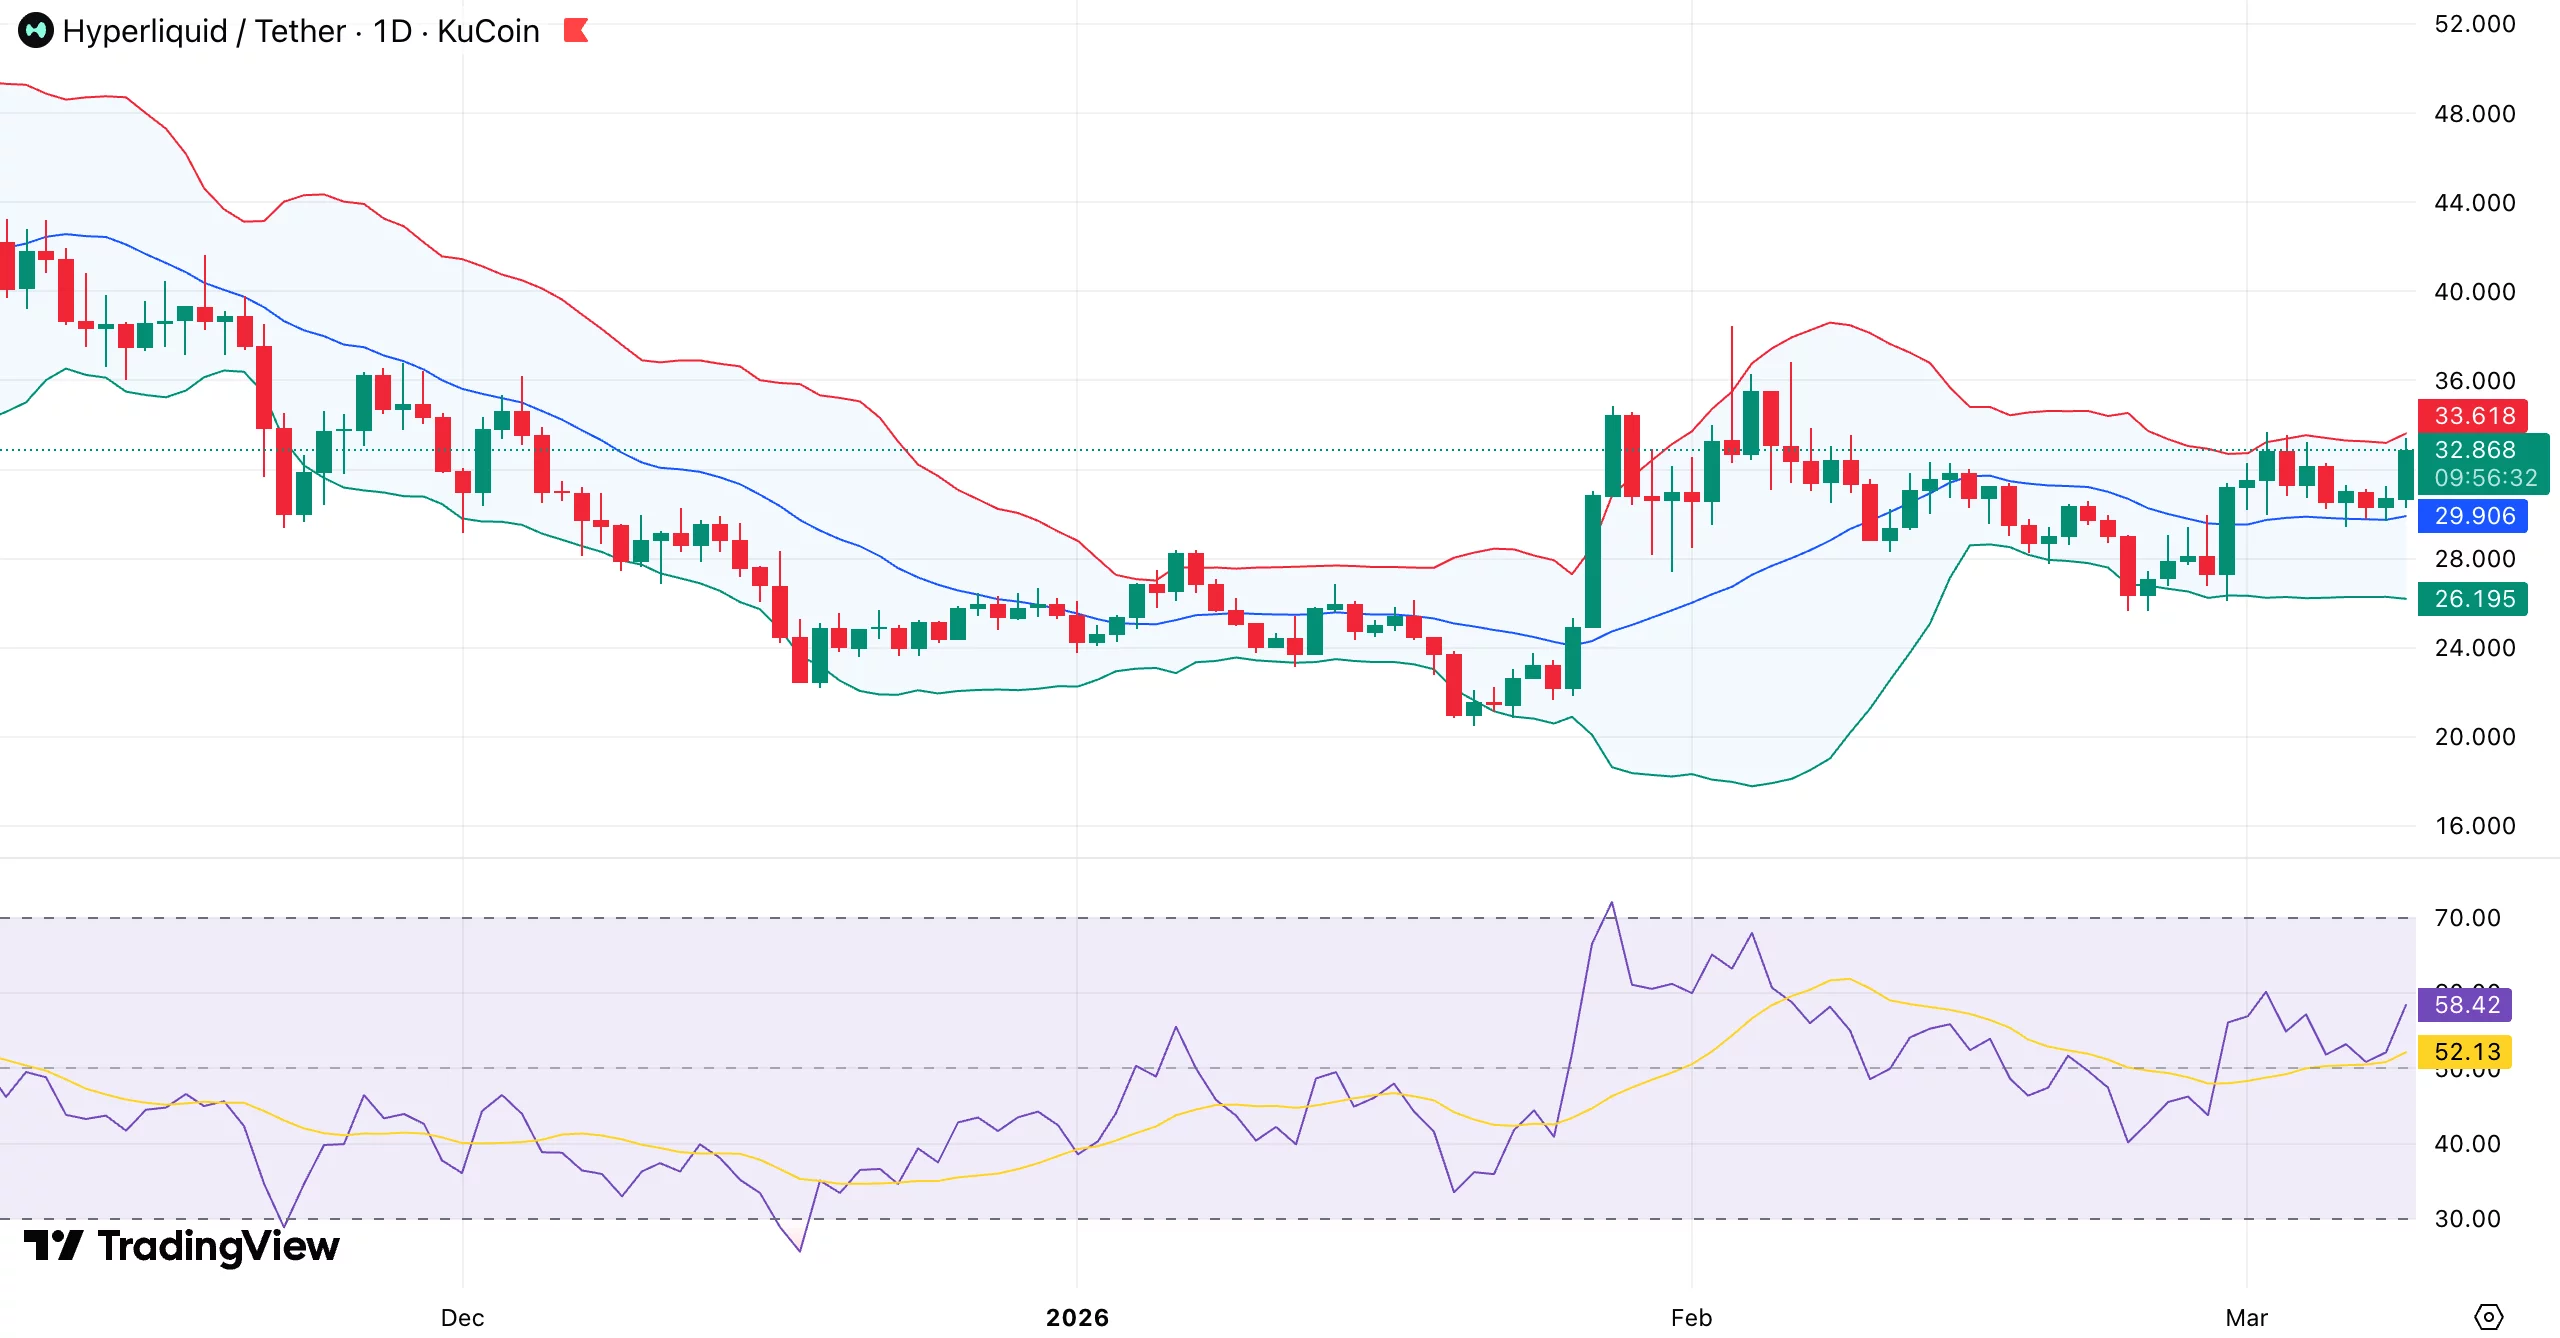
Volatility also appears to be returning. The Bollinger Bands are widening after a period of compression, a setup that traders often watch for stronger moves. At the moment, the price is pushing toward the upper band in the $33 to $36 range.
Momentum indicators point in the same direction. The relative strength index is hovering in the upper-50 zone. Before the market enters overbought territory, that level usually denotes growing momentum while allowing room for growth.
The chart also shows a pattern of higher lows since the rebound in late January, with buyers continuously protecting the $29 to $30 range. This kind of structure often depicts slow accumulation.
For now, the main barrier sits between $33 and $36, where the token has struggled to move higher in recent attempts. A clear break above that zone could shift attention toward the $40 level, which many traders see as the next psychological target.
If momentum fades, the first support lies near $29.9, while a deeper support zone sits around $26 to $27.


You May Also Like
Analog Devices (ADI) Pursues $1.5 Billion Acquisition of Empower Semiconductor

Why Businesses Need Professional Machine Design and Development Services