

Bitcoin Price Eyes Big Move as Peter Brandt Spots ‘Banana Split’ Pattern, Exchange Reserves Hit Record Low.

The post Bitcoin Price Eyes Big Move as Peter Brandt Spots ‘Banana Split’ Pattern, Exchange Reserves Hit Record Low. appeared first on Coinpedia Fintech News
Flagship cryptocurrency Bitcoin has started an upward move after climbing to $71,000 today. The move caught the attention of veteran trader Peter Brandt, who shared a chart pointing to a pattern he calls a “Banana Split.” According to Brandt, this setup could signal a large price move ahead for Bitcoin.
At the same time, data shows the amount of Bitcoin held on exchanges has dropped to an all-time low.
Peter Brandt Flags “Banana” Pattern on Bitcoin Chart
Bitcoin has started the month in positive territory, rising about 4.63% after closing the previous five months in the red. Amid this recovery, veteran trader Peter Brandt shared a chart showing Bitcoin moving inside a long-term curved channel that has guided its price trend for years.
Within that structure, Brandt pointed to a smaller curved formation now developing, which he calls the “Little Banana.” This pattern is forming inside a much larger arc that he refers to as the “Big Banana.”
According to Brandt, this setup usually appears when price moves sideways within a broader upward trend before the next major move begins.
His chart also points to repeating phases of roughly 52 weeks, where Bitcoin often shifts from consolidation into a stronger expansion period.
- Also Read :
- Crypto Market Today: Bitcoin Price Climbs to $70K as Oil Prices Drops Below $85
- ,
Bitcoin Exchange Reserves Supply Hit ATL
While technical patterns are forming on the chart, on-chain data shows another major shift taking place in the market.
Data from CryptoQuant indicates that the amount of Bitcoin held on exchanges has dropped to its lowest level on record.
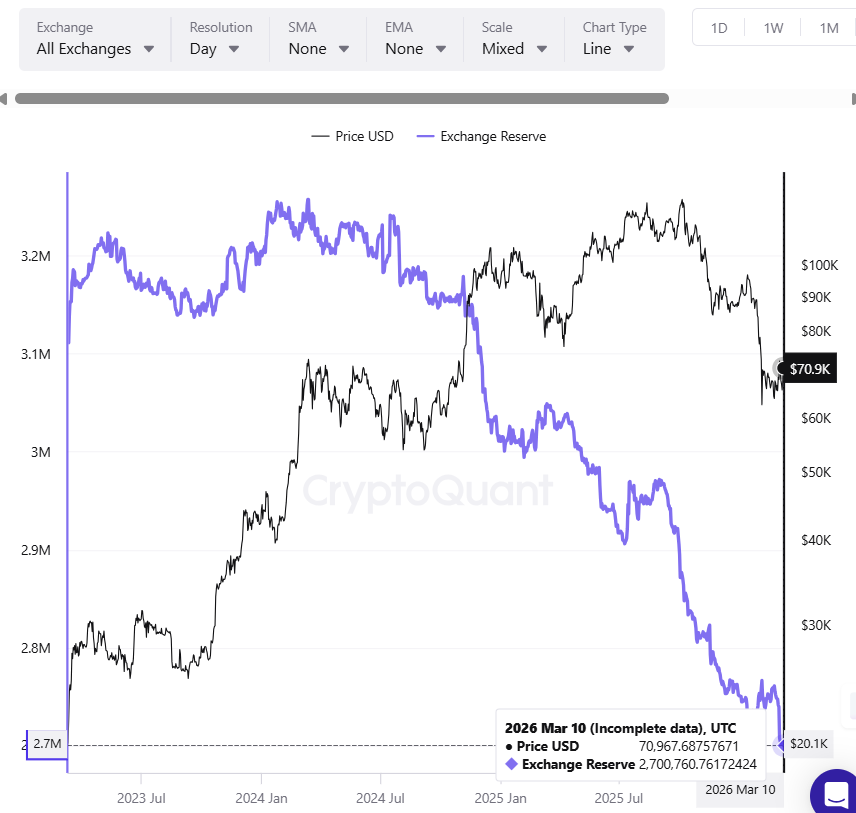
Earlier today, exchange reserves declined from more than 3.2 million BTC in 2023 to around 2.7 million BTC today. The steady drop suggests many investors are withdrawing their holdings from the exchange and moving them to private wallets or long-term storage.
Bitcoin Scarcity Becomes More Visible
At the same time, Bitcoin’s fixed supply model is becoming more apparent as the network recently passed another milestone.
More than 20 million BTC have now been mined out of the maximum supply of 21 million. This means over 95% of all Bitcoin that will ever exist is already in circulation.
With only about 1 million coins left to mine over the coming decades, the pace of new supply entering the market remains extremely limited.
Never Miss a Beat in the Crypto World!
Stay ahead with breaking news, expert analysis, and real-time updates on the latest trends in Bitcoin, altcoins, DeFi, NFTs, and more.
FAQs
Bitcoin is rising due to stronger market sentiment, declining exchange reserves, and technical patterns suggesting consolidation before a potential breakout.
If the pattern plays out as expected, Bitcoin could enter a stronger expansion phase. Analysts often view such setups as early signals of a possible rally.
Chart patterns help traders understand market trends and potential breakouts. They provide clues about investor behavior and possible price direction.


You May Also Like

Curious About What The CLARITY Act Says About XRP? Here Are The Parts To Focus ON

Turning Point USA leaders deliver a stinging warning to Trump as young MAGA voters turn


