

Bitcoin Sentiment Jumped Into FOMO Territory the Moment Price Crossed $70,000
Santiment’s social sentiment ratio for Bitcoin crossed above the FOMO zone threshold on March 10 as price breached $70,000, recording the third highest bullish bias reading of the entire month, with the crowd pointing to Donald Trump’s comments on a potential war resolution and oil prices reversing course as the catalysts driving the shift.
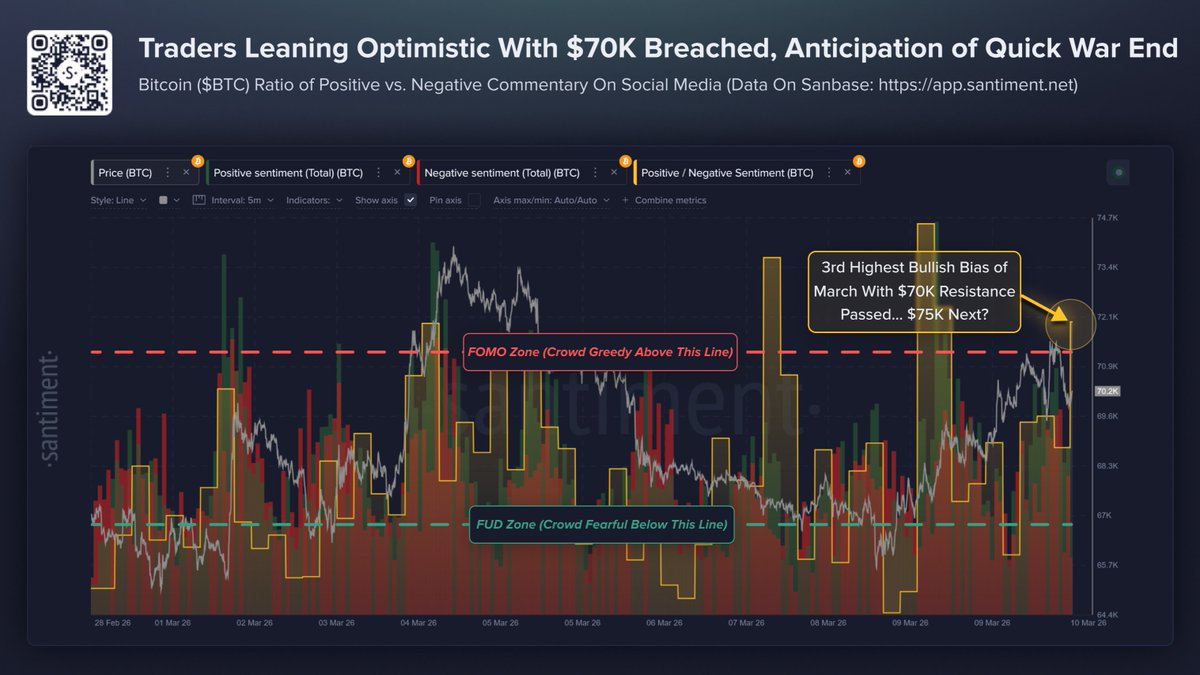
What the Sentiment Chart Shows
The Santiment positive-to-negative commentary ratio tracks Bitcoin discussion across X, Reddit, Telegram, and other crypto-focused platforms in real time. The chart running from late February through March 10 shows sentiment oscillating between the FUD zone below the green dashed line and the FOMO zone above the red dashed line, with price tracking the shifts with varying degrees of lag.
 Source: https://x.com/santimentfeed/status/2031484188113703117
The most notable feature of the chart is how quickly sentiment moved. Through March 6 and 7, as Bitcoin was sitting in the $65,000 to $68,000 range, sentiment was compressed near the FUD zone floor. The March 9 to 10 move above $70,000 produced an almost vertical sentiment spike that pushed the ratio to its third highest bullish reading of March. Two prior FOMO zone entries earlier in the month, visible as the yellow highlighted bars, also coincided with brief price spikes that subsequently faded.
That pattern is the cautionary detail embedded in the chart. Previous FOMO zone entries in March did not sustain. Each one was followed by a return toward the middle range or lower. Whether the current entry holds above the FOMO threshold or fades like its predecessors is the question the sentiment data raises without answering.
The Catalysts the Crowd Is Citing
Santiment identifies two specific narratives driving the sentiment shift beyond the price move itself. Trump’s public comments suggesting the war may end soon are circulating heavily in crypto social channels, connecting the geopolitical risk premium that has weighed on risk assets to a potential resolution catalyst. Oil prices reversing course after the G7 emergency reserve release covered earlier this week is the second driver. Both narratives describe a macro environment becoming less hostile to risk assets rather than any crypto-specific development.
The connection to earlier reporting this week is direct. The G7 oil reserve release article noted that BTC barely moved on the announcement itself. The sentiment data suggests the market has since reprocessed the macro signal. Oil coming off its highs removes one of the most cited headwinds for Bitcoin’s recovery, and traders are pricing in that shift through social sentiment before it fully appears in price.
What the Third Highest Bullish Bias Means
Santiment’s annotation on the chart asks the question directly: $75,000 next? The third highest bullish bias reading of March arrived with $70,000 resistance cleared. The prior two highest readings came at lower price levels and preceded pullbacks. The current reading is occurring at a higher price with a structural level broken, which is a different context than the earlier FOMO spikes.
Sentiment entering FOMO territory is a signal that cuts both ways. It reflects genuine optimism that often precedes continued momentum. It also reflects crowd positioning that can reverse sharply if price fails to follow through. At $70,000 broken and sentiment elevated, the market is exactly where the next move will be decided.
The post Bitcoin Sentiment Jumped Into FOMO Territory the Moment Price Crossed $70,000 appeared first on ETHNews.


You May Also Like

Santos Muscle Nutrition Announces U.S. Expansion Through Walmart.com

From Telegram to Terminal: Banana Gun’s Pro Platform Hits Ethereum as User Base Surpasses One Million


