

Aster price compresses within bullish broadening wedge, $1.05 in focus
Aster price is consolidating beneath key high-timeframe resistance as price compresses within a bullish broadening wedge pattern.
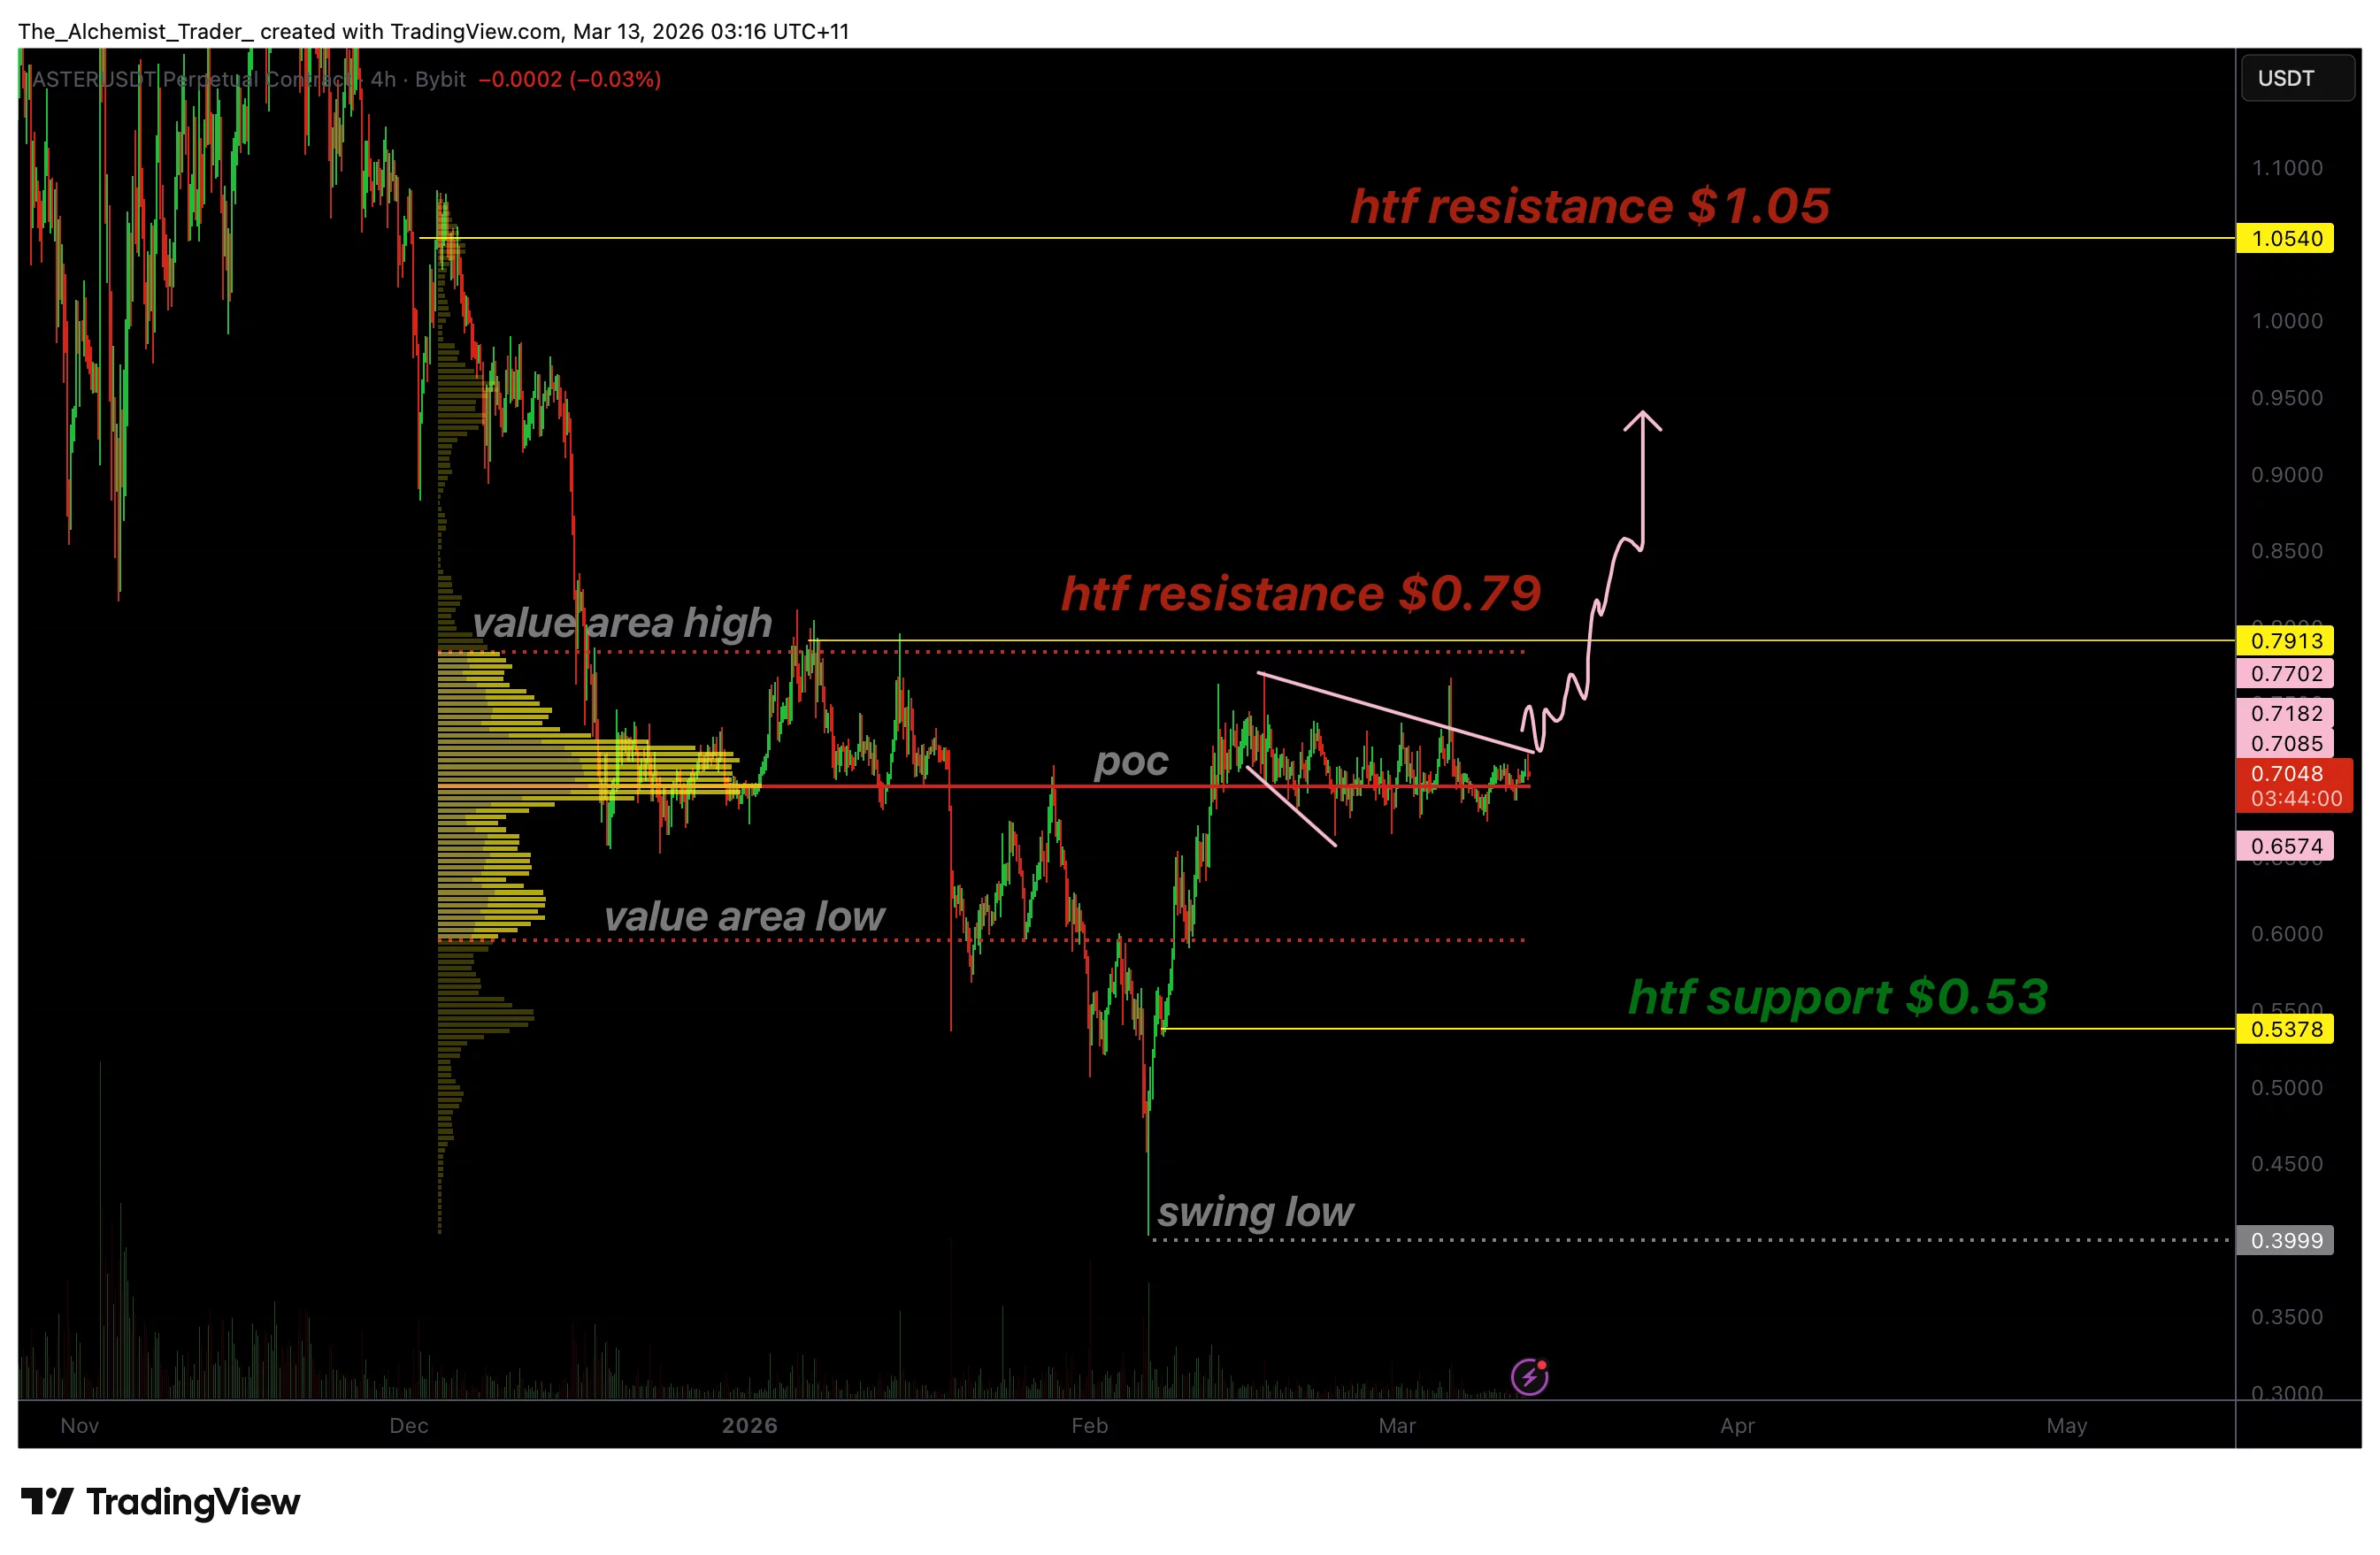
- Key Resistance: $0.79 remains the critical breakout level for bullish continuation.
- Bullish Pattern: Price compressing within a bullish broadening wedge structure.
- Upside Target: Breakout could trigger a measured move toward $1.05.
Aster’s (ASTR) recent price action is beginning to attract attention from technical traders as the asset consolidates within a bullish broadening wedge formation. After rebounding from a previous swing low, price has entered a period of compression near a critical high-timeframe resistance level.
This consolidation is occurring around the point of control, a zone where the highest amount of trading volume has historically taken place, often acting as a magnet for price before the next directional move unfolds.
If the bullish structure remains intact and resistance breaks, the setup could open the door for a significant rally toward the $1.05 region.
Aster price key technical points:
- High-timeframe resistance: $0.79 remains the key breakout level.
- Bullish broadening wedge: Price structure suggests building upside pressure.
- Technical target: A breakout could trigger a measured move toward $1.05.
Aster’s current structure shows price trading within a broadening wedge formation, a pattern often associated with increasing volatility and expanding price swings. Unlike traditional contracting patterns, a broadening wedge features widening support and resistance boundaries, reflecting an environment where buyers and sellers are actively testing both sides of the range. In Aster’s case, the structure is leaning bullish because price continues to hold above a key support region while gradually building pressure beneath resistance.
One of the most important levels within this structure is the point of control, the price zone that represents the highest traded volume within the current range. The point of control often acts as a fair-value area where buyers and sellers reach temporary equilibrium before the next directional move emerges. Aster’s price action currently rotating around this level suggests the market is still in a consolidation phase, absorbing liquidity before a potential expansion in volatility.
The bullish argument for Aster largely depends on the ability of price to break above the $0.79 high-timeframe resistance level. This area has historically acted as a barrier preventing further upside movement, making it a critical zone for confirmation. A clean breakout above this level would signal that buyers have regained control of market structure and that the current consolidation has successfully built enough momentum to push price higher.
From a technical perspective, the projected upside target of $1.05 is derived from the measured move of the current structure. This target is calculated by taking the distance from the recent swing low that initiated the current bullish leg and projecting that move from the point where the breakout occurs. Measured move projections are commonly used by traders to estimate potential continuation targets once price escapes consolidation patterns.
Another key factor supporting the bullish outlook is the broader structure of the wedge itself. For a bullish broadening wedge pattern to remain valid, price must continue respecting the two dynamic support and resistance trendlines that define the pattern. These expanding boundaries indicate that market participants are progressively testing higher and lower extremes, a characteristic that often precedes large directional breakouts when the pattern resolves.
However, confirmation will ultimately depend on volume behavior during the breakout attempt. A breakout that occurs on weak or declining volume may lead to a false move, commonly referred to as a liquidity sweep or bull trap. For the bullish scenario to fully materialize, traders will want to see strong and sustained buying pressure accompanying any move above the $0.79 resistance zone.
What to expect in the coming price action
As long as Aster continues consolidating above the point of control and maintains the bullish wedge structure, the probability of an upside breakout remains intact. A decisive move above $0.79 supported by strong volume could trigger the measured move toward the $1.05 target.
Failure to break resistance, however, could extend the current consolidation phase before the next major directional move develops.


You May Also Like

Amazon (AMZN) Stock: $48B India Investment Fuels Cloud Battle Against Tech Giants

Govt drafting new law to tighten e-commerce platform accountability, plug regulatory gaps

Saudi developer Ladun pursues move to main market


