

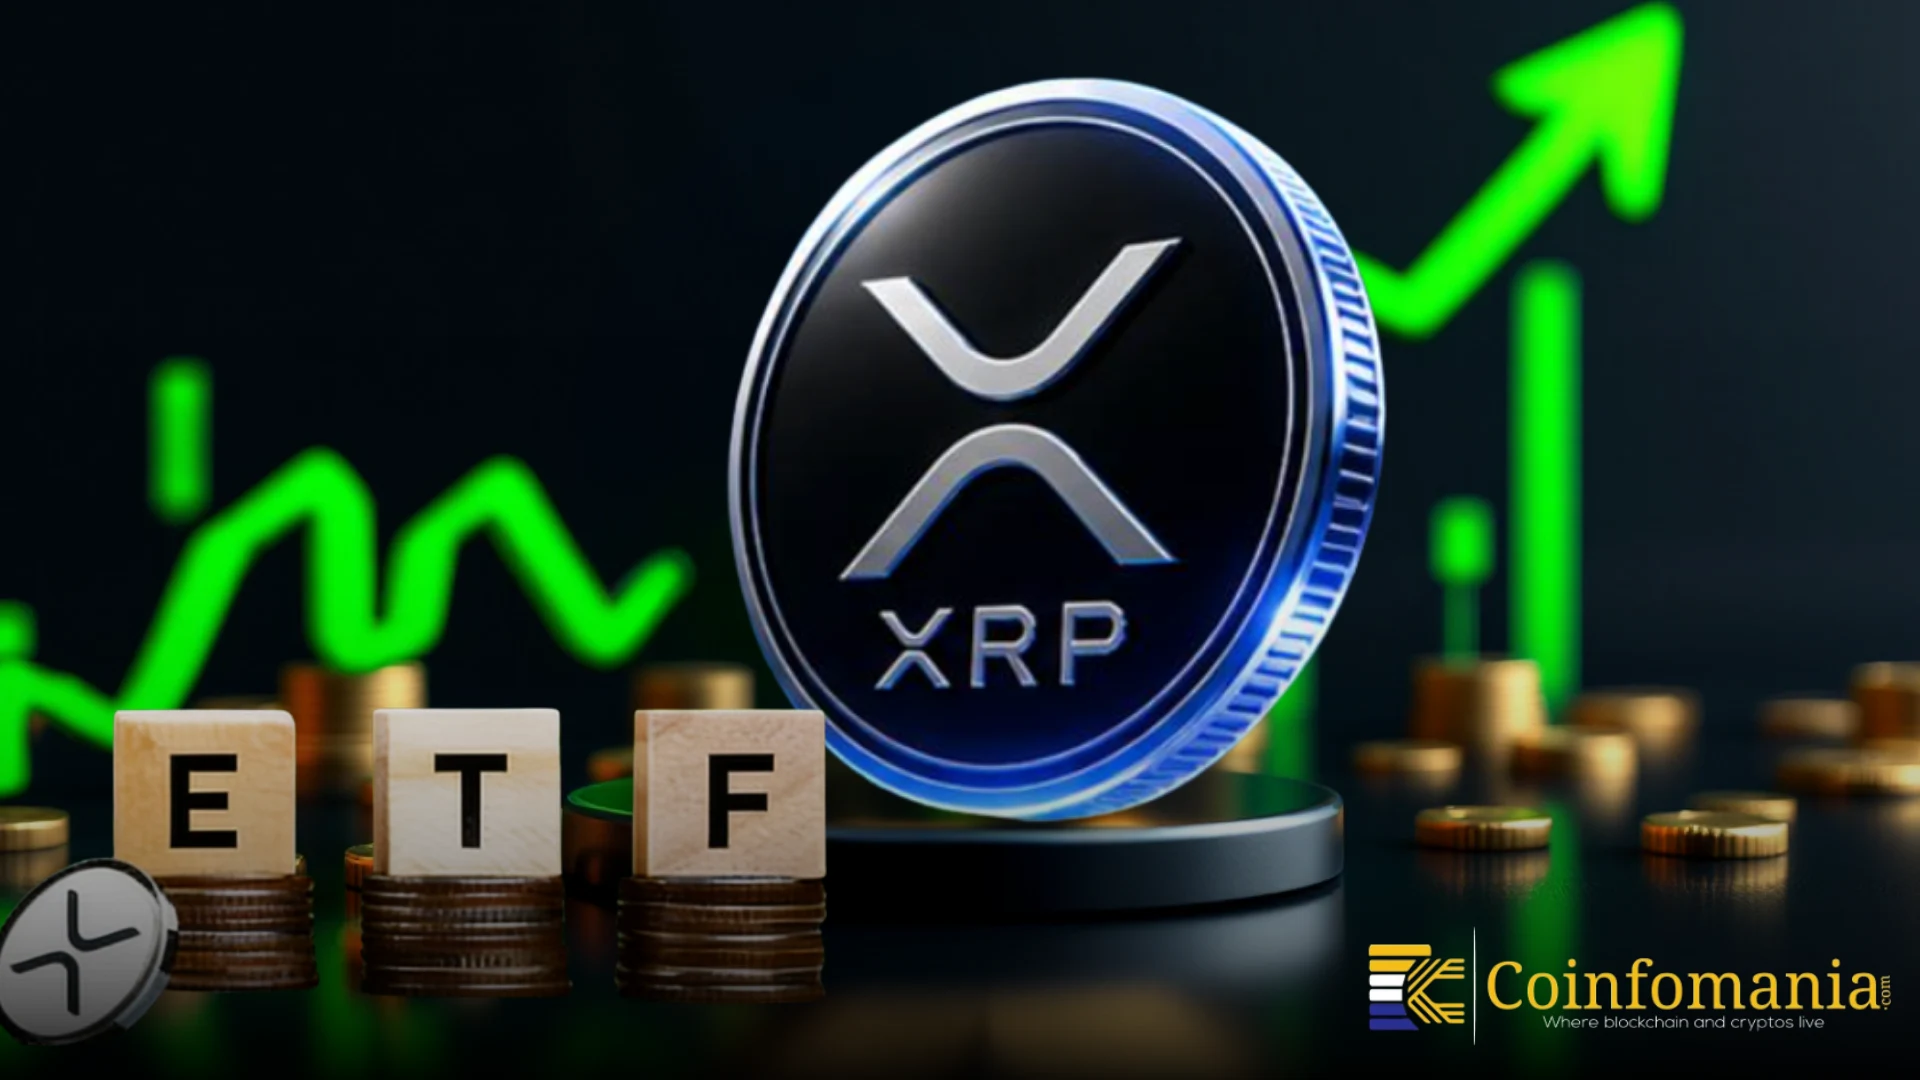
XRP to $48? Expert Says It Sounds Crazy Until You Look At This Chart
The cryptocurrency market has always thrived on bold predictions, but some projections immediately trigger skepticism among investors. A price target of $48 for XRP falls squarely into that category.
At first glance, the number appears wildly optimistic, especially when compared with the asset’s current trading range. However, a closer look at the long-term chart reveals why some analysts believe the target may not be as unrealistic as it initially seems.
Crypto commentator Diana recently revived the discussion on X after highlighting an analysis tied to popular market analyst Ali Martinez. According to Diana, the controversial $48 target does not come from speculation or hype. Instead, it emerges from XRP’s multi-year technical structure, which analysts believe has been quietly building pressure for a massive breakout.
XRP’s Multi-Year Triangle Formation
Technical analysts frequently study patterns that develop over extended periods because these formations often precede powerful market moves. XRP’s monthly chart shows one such structure—a long-term symmetrical triangle that began forming after the explosive rally during the 2017 Cryptocurrency Bull Run.
A symmetrical triangle forms when an asset creates lower highs and higher lows over time, compressing price action into a tightening range. This pattern signals that buyers and sellers have entered a prolonged phase of equilibrium. As the structure approaches its apex, volatility tends to contract before the market eventually chooses a direction.
In XRP’s case, this consolidation has lasted several years. Analysts argue that such extended compression often leads to dramatic breakouts once the price finally escapes the structure.
The Logic Behind the $48 Target
The $48 projection originates from technical measurements associated with the triangle breakout. Analysts typically calculate potential targets using Fibonacci extensions or the measured move method, which estimates how far the price could travel after breaking a long-standing pattern.
Using those techniques, analysts such as Martinez identified the upper extension zone near $48 as a possible long-term target if the breakout unfolds during a strong market cycle.
Importantly, analysts do not expect XRP to move directly from its current level to that target. Markets rarely move in straight lines, particularly after extended consolidation periods.
The More Realistic Step-By-Step Path
Most analysts believe XRP would likely climb through several major resistance levels before any extreme target becomes realistic. The first milestone would involve reclaiming the previous cycle high near $3.30, which remains one of the most significant resistance zones on the chart.
If bullish momentum continues beyond that point, analysts expect XRP to test higher zones around $7, $12, and potentially $20 before any euphoric phase of the market even begins.
For now, the $48 prediction remains an ambitious long-term scenario. Nevertheless, XRP’s unusually long consolidation pattern explains why traders and analysts continue to watch the chart closely. When an asset spends years building pressure, the eventual breakout can surprise even the most skeptical observers.
Disclaimer: This content is meant to inform and should not be considered financial advice. The views expressed in this article may include the author’s personal opinions and do not represent Times Tabloid’s opinion. Readers are urged to do in-depth research before making any investment decisions. Any action taken by the reader is strictly at their own risk. Times Tabloid is not responsible for any financial losses.
Follow us on Twitter, Facebook, Telegram, and Google News
The post XRP to $48? Expert Says It Sounds Crazy Until You Look At This Chart appeared first on Times Tabloid.


You May Also Like
Latest Ripple News and XRP Market Updates

Market Expert: If You Hold XRP, I Got News for You

CFTC Approves First Regulated Bitcoin Perpetual Contract


