

Will Bitcoin price reclaim $75,000 ahead of Fed rate decision?
Bitcoin price rallied to a 5-week high of $74,157 on Monday morning amid institutional and whale accumulation. Can the bellwether climb past the $75,000 psychological support level ahead of the Federal Reserve interest rate decision set to be revealed later this week?
- Bitcoin price rose to a five-week high of $74,157 as institutional inflows and whale accumulation pushed the asset higher.
- U.S. spot Bitcoin ETFs have attracted $2.1 billion in inflows over the past three weeks, while large wallets increased their share of the total supply.
- Markets are now watching the $75,000 resistance level ahead of the Federal Reserve interest rate decision expected later this week.
According to data from crypto.news, Bitcoin (BTC) price briefly rose nearly 4% to $74,157 on March 16, pushing its market cap back above $1.48 trillion. Trading at $73,626 when writing, the bellwether now lies 17% above its lowest point this year.
Bitcoin’s price rebound today came as institutions and whales kept buying the dip to bet on the safe-haven asset amid ongoing geopolitical tensions.
Notably, U.S. spot Bitcoin ETFs have experienced back-to-back net inflows over the past three weeks, bringing the total figure to $2.1 billion. The persistent inflow trend has boosted retail sentiment for the token, supporting its gains.
At the same time, Bitcoin’s gains seem to have been supported by whale accumulation. According to on-chain data from Santiment, wallets holding between 10 and 10,000 BTC have entered an accumulation phase, increasing their share of the total supply to 68.17%.
This was noted as a “bullish signal” by Santiment, as it suggests that Bitcoin was moving into the wallets of long-term holders.
Meanwhile, the aggressive buying from Bitcoin treasury companies such as Michael Saylor’s MicroStrategy and Metaplanet has also provided a significant price floor.
In their most recent filings, Strategy has continued its multi-billion-dollar acquisition strategy, while Metaplanet has mirrored this “debt-for-Bitcoin” model to expand its holdings in the Japanese market.
Retail investors have also been rotating capital away from traditional safe-haven assets such as gold and silver into Bitcoin as they prepare for further volatility amid escalating conflict between the U.S. and Iran.
The military escalation and attacks on Iranian infrastructure (such as Kharg Island) have led crude prices to spike to multi-year highs as Iran threatened a total blockade of the Strait of Hormuz, a key global oil artery.
The next catalyst for Bitcoin price
For now, a major catalyst for Bitcoin price would be the Federal Reserve rate cut decision scheduled to be announced on Wednesday, March 18, at 2:00 PM ET.
Economists broadly expect the Federal Reserve to keep interest rates steady in the 3.50% to 3.75% range, likely maintaining a cautious stance as inflation continues to remain elevated due to the shock in oil prices.
While steady rate expectations have historically tempered the rally of risk assets, Bitcoin’s current momentum and its emergence as “digital gold” suggest that a break above the $75,000 psychological resistance could trigger a massive short squeeze toward the $80,000 mark.
Bitcoin price analysis
At press time, technical indicators on the Bitcoin/USDT 1-day chart also seem to present a bullish setup that suggests a significant trend reversal is underway.
Bitcoin price has moved above the 50-day simple moving average at $71,164, which is a key psychological and technical level. Last time when it crossed above this trendline back in early February, BTC rallied nearly 33% within a month.
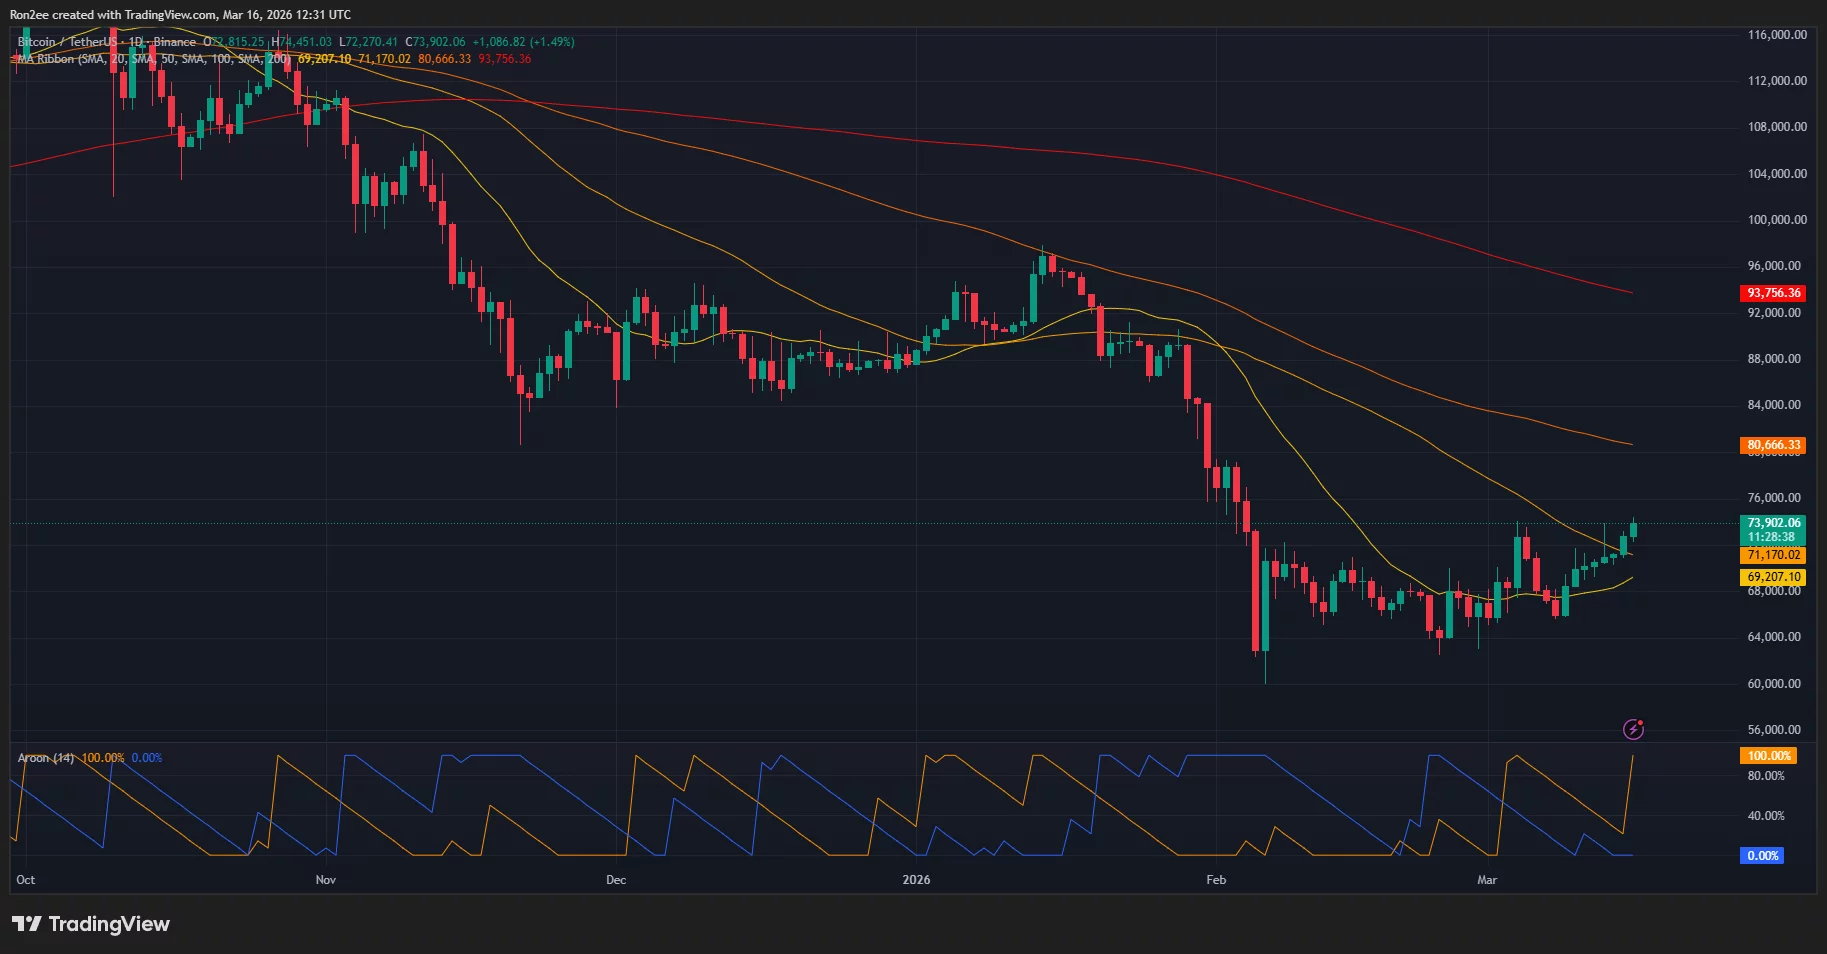
The 20-day SMA is also on the cusp of completing a bullish crossover with the 50-day SMA, a classic signal often referred to as a golden cross that typically precedes sustained upward momentum.
At the same time, the Aroon lines also added to the bullish outlook with the Aroon Up at 100% in comparison to the Aroon Down at 0%. This is a powerful configuration that hints at a strong emerging uptrend and suggests that buyers are in complete control of the current price action.
For now, the $75,000 zone, which has historically acted as a psychological barrier for traders, will serve as key resistance that would decide the short-term trajectory of the asset. A break above it could embolden bulls to target the next resistance pivot at $80,665.
On the contrary, a drop below the $70,000 support level could invalidate the current breakout and lead to a period of consolidation.
Disclosure: This article does not represent investment advice. The content and materials featured on this page are for educational purposes only.


You May Also Like

Zacks Initiates Coverage on Versus Systems, Citing Gamification Growth and Improved Finances

ETH Enters High-Stakes Decision Zone

US conducts air strikes on Iran after Trump signs ceasefire deal


