

XRP Consolidates Inside a Compression Channel After Months of Decline
XRP has spent the better part of two months grinding through a narrowing price structure, and the pattern forming on the macro chart is starting to attract attention from analysts watching for a potential turning point.
At $1.49 at the time of writing, the asset sits at a crossroads that could define its direction through April.
 Source: https://www.tradingview.com/chart/Kp2BMI6e/?symbol=BINANCE%3AETHUSDT
What the Macro Chart Reveals
Crypto Trader GainMuse published a detailed read of the XRP/USDT structure on the 6-hour chart using Bybit data. The picture spans from November 2025 through mid-March 2026 and tells a story of consecutive compression phases, each one tightening the range that XRP trades within.
The sequence started with a triangle pattern through November and December 2025, where XRP was already making lower highs within a broader descending structure. That pattern resolved to the downside in early January, sending XRP into a steep downward channel that wiped out a significant portion of its late 2025 gains. From above $2.40, XRP slid toward $1.20 through February.
What has developed since is the compression channel. After the sharp February low, XRP stopped making aggressive new lows and began oscillating in a tightening band between roughly $1.30 and $1.55. That band is narrowing. The upper and lower boundaries are converging, which means a directional resolution is approaching whether buyers or sellers want it or not.
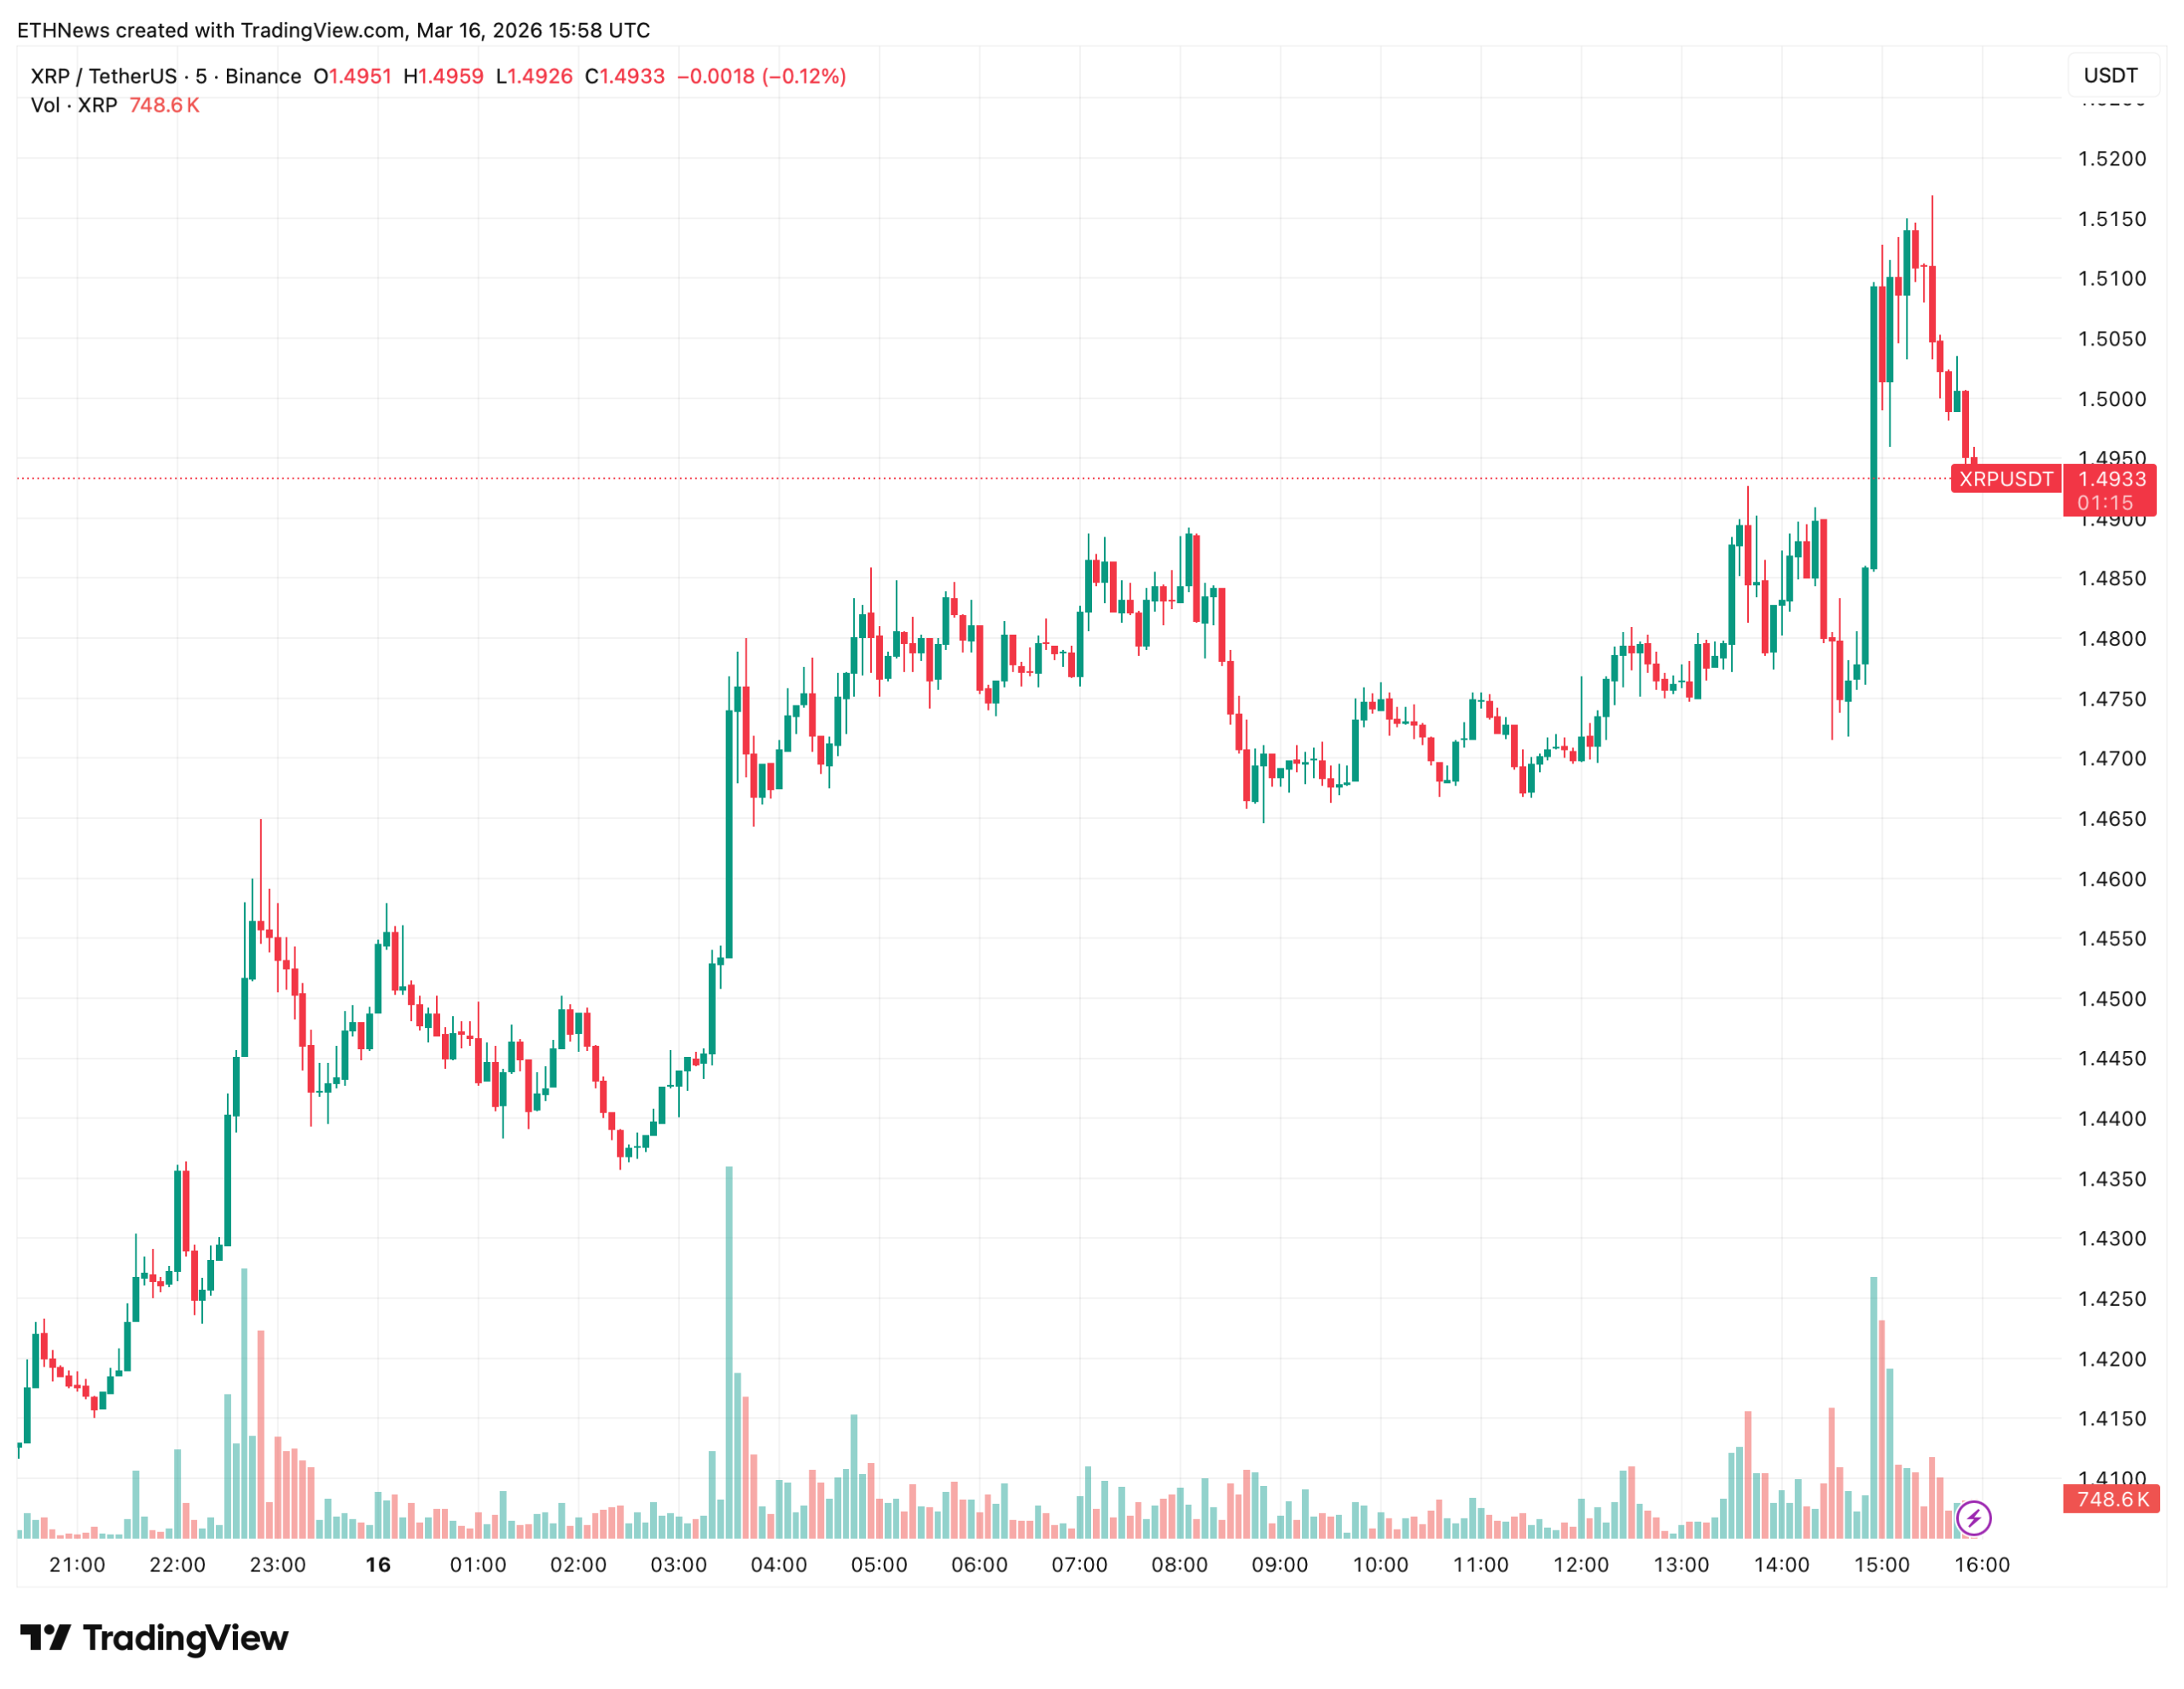
The Intraday Picture
The 5-minute chart on Binance for March 16 fills in the short-term detail. XRP came into the session near $1.41, climbed sharply in the early hours of the session, consolidated in a choppy range through the morning, then pushed higher again in the afternoon to briefly touch $1.52 before pulling back. The session high came on the largest volume spike of the day. The subsequent retreat to $1.4933 at the time of writing happened on lighter selling volume, which suggests profit-taking rather than a structural reversal.
The session as a whole has a positive shape. Higher lows through the middle hours, a push to new intraday highs late in the day, and no significant breakdown below support. XRP is holding the gains from earlier in the session, as covered in reporting today on the 10% weekly move.
Two Scenarios From Here
GainMuse lays out the binary clearly. If buyers can reclaim the upper boundary of the compression channel, XRP could attempt a climb toward the long-term resistance line sitting above current price, which on the macro chart aligns somewhere in the $1.70 to $1.80 range. That resistance line has been declining since the highs above $2.40 and remains a meaningful ceiling.
The failure scenario is equally defined. If momentum fades and XRP loses the lower boundary of the compression channel, the structure points back toward the deeper support zone around $1.20 to $1.25 where the February lows were established.
The compression channel does not tell you which way price goes. It tells you that the range of indecision is narrowing and that the next significant move, in either direction, is getting closer. For XRP, a token that spent most of the past year as one of the market’s more volatile major assets, that compression is itself a meaningful development.
What breaks it will depend on whether spot demand materializes at current levels or continues to sit on the sidelines.
The post XRP Consolidates Inside a Compression Channel After Months of Decline appeared first on ETHNews.


You May Also Like

Prediction markets get CFTC relief as legal battles widen

Metaplanet Stock: How a 24% Bitcoin Drop Erased Strong Operating Gains


