

Slippage: The most underrated profit killer in trading
Author: CryptoPunk
Many crypto traders have experienced the same disappointment: backtesting shows consistent profits, but once they actually trade, they find their returns shrinking rapidly, sometimes even turning from profit to loss. The problem is often not that they "judged the direction wrong," but rather that trading costs, especially slippage, were underestimated.
In the crypto market, where bull and bear markets shift more rapidly, volatility is greater, and the market is more fragmented, slippage is not just a trivial decimal point; it's a real threshold that determines whether a strategy can survive. A slippage of 2 or 3 bps, in a high-turnover strategy, is enough to wipe out the entire alpha on paper.
Based on long-term backtesting of BTC/USDT and ETH/USDT, this article attempts to answer a very practical question: to what extent does slippage erode strategy returns, and which strategies are most likely to fail due to slippage?
1. Introduction: Why slippage is always underestimated
Traders underestimate slippage for three main reasons.
First, many backtests assume that closing price, opening price, or even the midpoint of the price range will be used for trading, which is inherently optimistic. Second, many people only calculate transaction fees, not slippage, let alone the slippage on both the opening and closing sides. Third, many people assume that slippage is a fixed value, but in the real market, slippage changes with volatility, trading volume, order size, and liquidity.
This is why many strategies that look good in Excel or backtesting frameworks often malfunction when used in live trading. Profits aren't as substantial as expected, while costs are much higher than anticipated.
2. Research Methodology: BTC/ETH Backtesting Design
This study maintained the strategies and slippage framework of the current project, only expanding the time frame and output results.
- Assets: `BTCUSDT`, `ETHUSDT`
- Binance Vision publicly available spot Kline 1m
- Sample period: January 1, 2020 to December 31, 2025
- Run date: March 15, 2026
- Note: During the actual inspection on March 15, 2026, Binance Vision's publicly available spot 1m data returned a 404 error after January 2026. Therefore, this article uses the latest available date, December 31, 2025, as the sample endpoint.
- Execution rule: The signal is generated at the close of the current bar, and the transaction is completed at the open of the next bar.
To make the results easier to reproduce, the core execution parameters used in this article are as follows:
| parameter | set up |
|---|---|
| Initial capital | 100,000 USDT |
| Default transaction fee rate | 0.05% (one-sided), approximately 5 bps |
| Round-trip handling fee | Approximately 10 bps, excluding slippage. |
| Ordering mode | Orders based on account equity ratio |
| Default order size | 15% Account Equity |
| lever | `1x` |
| Is bidirectional operation allowed? | allow |
Strategies are divided into three categories:
- Low frequency: Follow the trend of the 20/50 moving average, 1H
- Intermediate frequency: RSI + MA filter, 15 min
- High-frequency approximation: Short-period mean regression, 5min
The slippage model includes:
- Fixed bps: `1 / 3 / 5 / 10 / 20 bps`
- Volatility-related slippage
- Trading volume impact slippage
- Bilateral asymmetric slip
- Extreme market conditions penalty items
The core conclusions of this article are mainly based on the reference scenario of "extreme_volume_impact + transaction fees", because it is closer to the state of "amplified volatility + two-sided costs" in real transactions.
3. Backtesting results: First, look at the most important groups.
If you only look at the gross profit, many strategies can still be a good story; but once you add in the fees and slippage, the story quickly ends.
The most typical example is the high-frequency mean reversion of BTC:
- Excluding costs, the net profit is 84,534.
- After accounting for transaction fees alone, the net profit becomes -99,168.
- Adding slippage, net profit further deteriorated to -99,896.
- This strategy resulted in 36,008 transactions, with transaction fees of 66,456 and slippage costs of 46,966.
In other words, its problem isn't even that "the slippage is a little high," but rather that the strategy's single-trade advantage is simply not thick enough, and the cost is completely wiped out when it's added up.
On the other hand, the `ETH` low-frequency trend strategy is one of the few combinations in this sample that can still maintain positive returns after deducting costs:
- Net profit, excluding costs, is 48,948.
- After deducting transaction fees alone, the net profit was 23,664.
- Even after accounting for slippage, the net profit is still 13,463.
This shows that slippage doesn't make all strategies worse, but rather it filters which strategies have a sufficiently strong advantage and which only "look profitable in backtesting".
To more clearly visualize cost erosion, let's first look at a summary table of core results. The "Fee + Slippage" in the table below uses the reference scenario `extreme_volume_impact` from this article.
| assets | Strategy | Gross profit Net profit | Net profit based only on transaction fees | Net profit from commissions and slippage | Transaction fees | Slippage cost | Number of transactions |
|---|---|---|---|---|---|---|---|
| BTC | Low frequency trend | 10,557 | -8,617 | -14,898 | 19,009 | 7,118 | 1,268 |
| BTC | Intermediate Frequency RSI+MA | 169 | 94 | 60 | 75 | 35 | 5 |
| BTC | High-frequency mean regression | 84,534 | -99,168 | -99,896 | 66,456 | 46,966 | 36,008 |
| ETH | Low frequency trend | 48,948 | 23,664 | 13,463 | 22,322 | 10,238 | 1,238 |
| ETH | Intermediate Frequency RSI+MA | 5 | -175 | -260 | 180 | 84 | 12 |
| ETH | High-frequency mean regression | -29,338 | -99,665 | -99,934 | 39,020 | 60,551 | 31,421 |
This chart compares the net profit performance under different slippage models. Fixed bps is only the starting point of cost pressure. When slippage begins to correlate with volatility, trading volume shocks, and extreme market conditions, the strategy's returns will decline significantly. For high-frequency strategies, once the model is upgraded from "fixed slippage" to "dynamic slippage," profits often don't just thin out, but disappear entirely.
A comparison of the returns of different slippage models shows that fixed bps is only the most conservative starting point; when slippage begins to correlate with volatility, trading volume shocks, and extreme market conditions, many strategies that were barely surviving will quickly fall below the break-even point.
4. The erosion of returns by slippage
The most terrifying thing about slippage is not just that it "reduces a little profit", but that it often drives a strategy directly from the winning zone into the losing zone.
In this experiment, a total of 54 vulnerable cases were identified where "gross revenue was positive but net revenue was negative"; in the model comparison dimension alone, there were 40 such combinations.
The most typical examples of accidents include:
- Low-frequency BTC trend: Gross profit of 10,557, which becomes -8,617 after accounting for transaction fees, and -14,898 after adding slippage.
- ETH mid-frequency RSI+MA: Gross profit was only 4.53, turning negative immediately after adding transaction fees, and losses further amplified with slippage.
- BTC high-frequency mean reversion: The paper profit is very obvious, but after cost, it almost becomes zero.
This is why "profitable backtesting but loss in live trading" is so common in the crypto market. The problem with many strategies isn't that the direction or logic is wrong, but that they are based on the assumption from the beginning that "transaction costs are almost non-existent."
The chart above compares the net asset value (NAV) of a high-frequency mean reversion strategy for BTC. The blue line represents the backtested NAV without considering costs, while the green line represents the actual NAV after factoring in transaction fees and slippage. The former appears as a curve that can continuously compound, while the latter is almost continuously rubbed down to near zero.
The cost structure also illustrates the problem. Take the reference slippage model as an example:
- The slippage cost of a high-frequency BTC strategy is equivalent to 347% of its gross revenue.
- The transaction fee cost is equivalent to 491% of the gross profit.
- In the low-frequency trend of BTC, slippage costs account for approximately 63% of gross revenue.
- In the low-frequency trading trend of ETH, slippage costs account for approximately 22% of gross revenue.
This means that low-frequency strategies are more about "compressing profits", while high-frequency strategies are about "directly swallowing up profits".
If we consider returns, Sharpe ratio, and drawdown together, the impact of cost on the strategy profile becomes even more apparent:
| assets | Strategy | Scene | Net profit | Sharpe | Maximum drawdown |
|---|---|---|---|---|---|
| BTC | Low frequency trend | No cost | 10,557 | 0.23 | -13.99% |
| BTC | Low frequency trend | Fees + Slippage | -14,898 | -0.25 | -24.32% |
| BTC | High-frequency mean regression | No cost | 84,534 | 1.22 | -7.33% |
| BTC | High-frequency mean regression | Fees + Slippage | -99,896 | -13.10 | -99.90% |
| ETH | Low frequency trend | No cost | 48,948 | 0.62 | -22.08% |
| ETH | Low frequency trend | Fees + Slippage | 13,463 | 0.24 | -25.22% |
| ETH | High-frequency mean regression | No cost | -29,338 | -0.47 | -36.72% |
| ETH | High-frequency mean regression | Fees + Slippage | -99,934 | -11.35 | -99.93% |
5. Why are high-frequency strategies most easily killed by slippage?
High-frequency strategies are most easily killed by slippage, not because they are bad at judging certain directions, but because their profit structure is too thin.
High-frequency strategies typically share three common characteristics:
- Low profit per transaction
- Extremely high number of transactions
- Extremely sensitive to transaction prices
In this backtest, the average cumulative slippage costs for the three strategies under the reference slippage model were as follows:
- High frequency: `53,758`
- Low frequency: `8,678`
- Mid-frequency: `59`
In other words, the main impact of slippage is highly concentrated on high-turnover strategies.
From the perspective of trading frequency, the average profiles of the three types of strategies under the slippage model are as follows:
| frequency | Average net profit | Average cumulative slippage cost | average realized slippage | Average number of transactions |
|---|---|---|---|---|
| high frequency | -99,915 | 53,758 | 5.65 bps | 33,714 |
| low frequency | -718 | 8,678 | 2.08 bps | 1,253 |
| Intermediate frequency | -100 | 59 | 2.32 bps | 9 |
This chart illustrates the "net profit erosion" of different frequency strategies. High-frequency strategies are almost precipitously higher than mid- and low-frequency strategies, indicating that in the crypto market, slippage is highly concentrated on high-turnover strategies. Many high-frequency systems don't fail to make money; rather, they don't make enough to offset the continuous friction caused by frequent trading.
More importantly, slippage is not a simple linear relationship with trading frequency; it can "accelerate" under high volatility and large orders.
Taking a high-frequency strategy under the reference model as an example, the average amplification factor of slippage cost per trade in a high-volatility state relative to a low-volatility state is:
- BTC: 2.33x
- ETH: 3.99x
This erosion becomes more pronounced when order volume increases:
- The average realized slippage of the BTC high-frequency strategy increased from 2.24 bps to 5.70 bps.
- The high-frequency strategy for ETH increased from 3.40 bps to 16.34 bps.
Graph Explanation: This graph illustrates the cumulative slippage loss at different order sizes. The curve is not a smooth straight line, but rather more closely resembles a convex rise. Especially for ETH high-frequency strategies, slippage deteriorates very rapidly as the position size increases from 5% to 35%.
This chart is very important. It illustrates a reality that many traders overlook during backtesting: position size isn't simply increased; slippage is often amplified convexly. A strategy that works with small capital doesn't guarantee its success when scaled up.
6. Differences between BTC and ETH
Many traders intuitively believe that BTC is more "expensive," so slippage should be higher. However, real backtesting results show a more nuanced picture.
To view the total slippage loss, refer to the slippage model below:
- Average cumulative slippage cost for BTC: 18,039
- Average cumulative slippage cost for ETH: 23,624
If we look at the realized slippage bps per unit traded, the cost pressure on ETH is even more pronounced:
- `BTC` average realized slippage: `2.57 bps`
- `ETH` average realized slippage: `4.13 bps`
Breaking it down by strategy, ETH has a higher slippage bps than BTC in every strategy category:
- High frequency: BTC 3.53 bps vs ETH 7.76 bps
- Low frequency: `BTC 1.87 bps` vs `ETH 2.29 bps`
- Mid-frequency: `BTC 2.31 bps` vs `ETH 2.34 bps`
It's easier to understand the differences by looking at BTC and ETH in the same table:
| Dimension | BTC | ETH |
|---|---|---|
| Average net profit in reference scenarios | -38,245 | -28,910 |
| Average cumulative slippage cost | 18,039 | 23,624 |
| average realized slippage | 2.57 bps | 4.13 bps |
| High-frequency realized slippage | 3.53 bps | 7.76 bps |
| Low-frequency realized slippage | 1.87 bps | 2.29 bps |
| Intermediate frequency realized slippage | 2.31 bps | 2.34 bps |
Chart Explanation: This chart shows the cumulative slippage cost in absolute USD terms. ETH's total slippage cost is higher than BTC in this sample, indicating that even if it's not "harder" than BTC at all times, ETH is more sensitive to liquidity frictions from a long-term execution cost perspective.
The implication is straightforward: BTC isn't always worse in terms of absolute trading volume and strategy turnover, but from the perspective of "unit liquidity cost," ETH is more susceptible to slippage, especially in high-frequency and high-volatility scenarios.
Chart Explanation: This chart provides a relatively positive reference point. ETH low-frequency trend strategies perform better without slippage. With transaction fees and slippage added, profits are significantly compressed, but positive returns are still maintained. This illustrates that slippage doesn't render all strategies ineffective, but rather filters which strategies have sufficiently strong advantages and which are merely based on ideal trading assumptions.
This explains why, while low-frequency trend strategies on ETH can still be profitable, the profits are significantly compressed compared to the no-slippage version. It shows that ETH isn't unworkable, but rather that a sufficient safety margin must be provided for execution costs.
7. Conclusion: Slippage is not a small error, but a matter of life or death for the strategy.
The conclusion drawn from this backtest is very clear.
First, slippage is not a dispensable parameter in backtesting; it's a key variable determining whether a strategy is truly tradable. Second, many backtests show profits but live trading results in losses not because the strategy suddenly fails, but because the paper backtests assume overly ideal trading conditions. Third, high-frequency strategies are most vulnerable to slippage because they essentially trade extremely high turnover for extremely thin single-trade advantages. Fourth, ETH's slippage pressure is generally higher than BTC's, especially in high-volatility and high-turnover scenarios. Fifth, the larger the order size, the less linearly slippage erosion tends to increase, and the more convex the slippage amplification becomes.
For crypto traders, the real question isn't "How much can this strategy earn in backtesting?", but rather:
- How much is left after the bilateral transaction fees?
- How much is left after reasonable slippage?
- Will it survive during periods of high volatility and low liquidity?
- With increased funding, will it turn from making money to losing money?
If these questions remain unanswered, the so-called high-yield backtesting likely just hides the most crucial cost assumptions.


You May Also Like
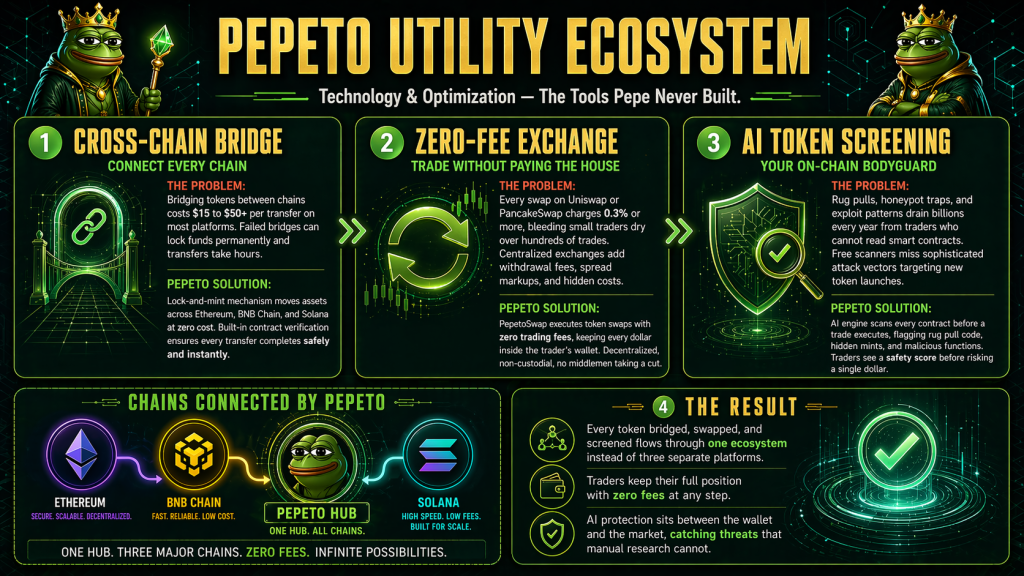
Which Are the Top 3 Cryptos to Buy Now as Solana Lands Mastercard and Pepeto Presale Nears Sold-Out Close
Ondas (ONDS) Stock Soars After Revenue Explodes Over 1,000% in Q1 2026


