

Dogecoin (DOGE) Forms Critical Falling Wedge Pattern as Traders Watch $0.10 Level
Key Takeaways
- A falling wedge formation is developing on DOGE’s daily chart, a pattern that often signals significant price action ahead.
- Immediate resistance levels are concentrated between $0.105 and $0.11, coinciding with important Fibonacci levels.
- The Relative Strength Index has climbed out of oversold conditions and is nearing neutral territory with modest bullish momentum.
- The 50-day exponential moving average presents a critical overhead obstacle, and a decisive reclaim would signal a potential trend reversal.
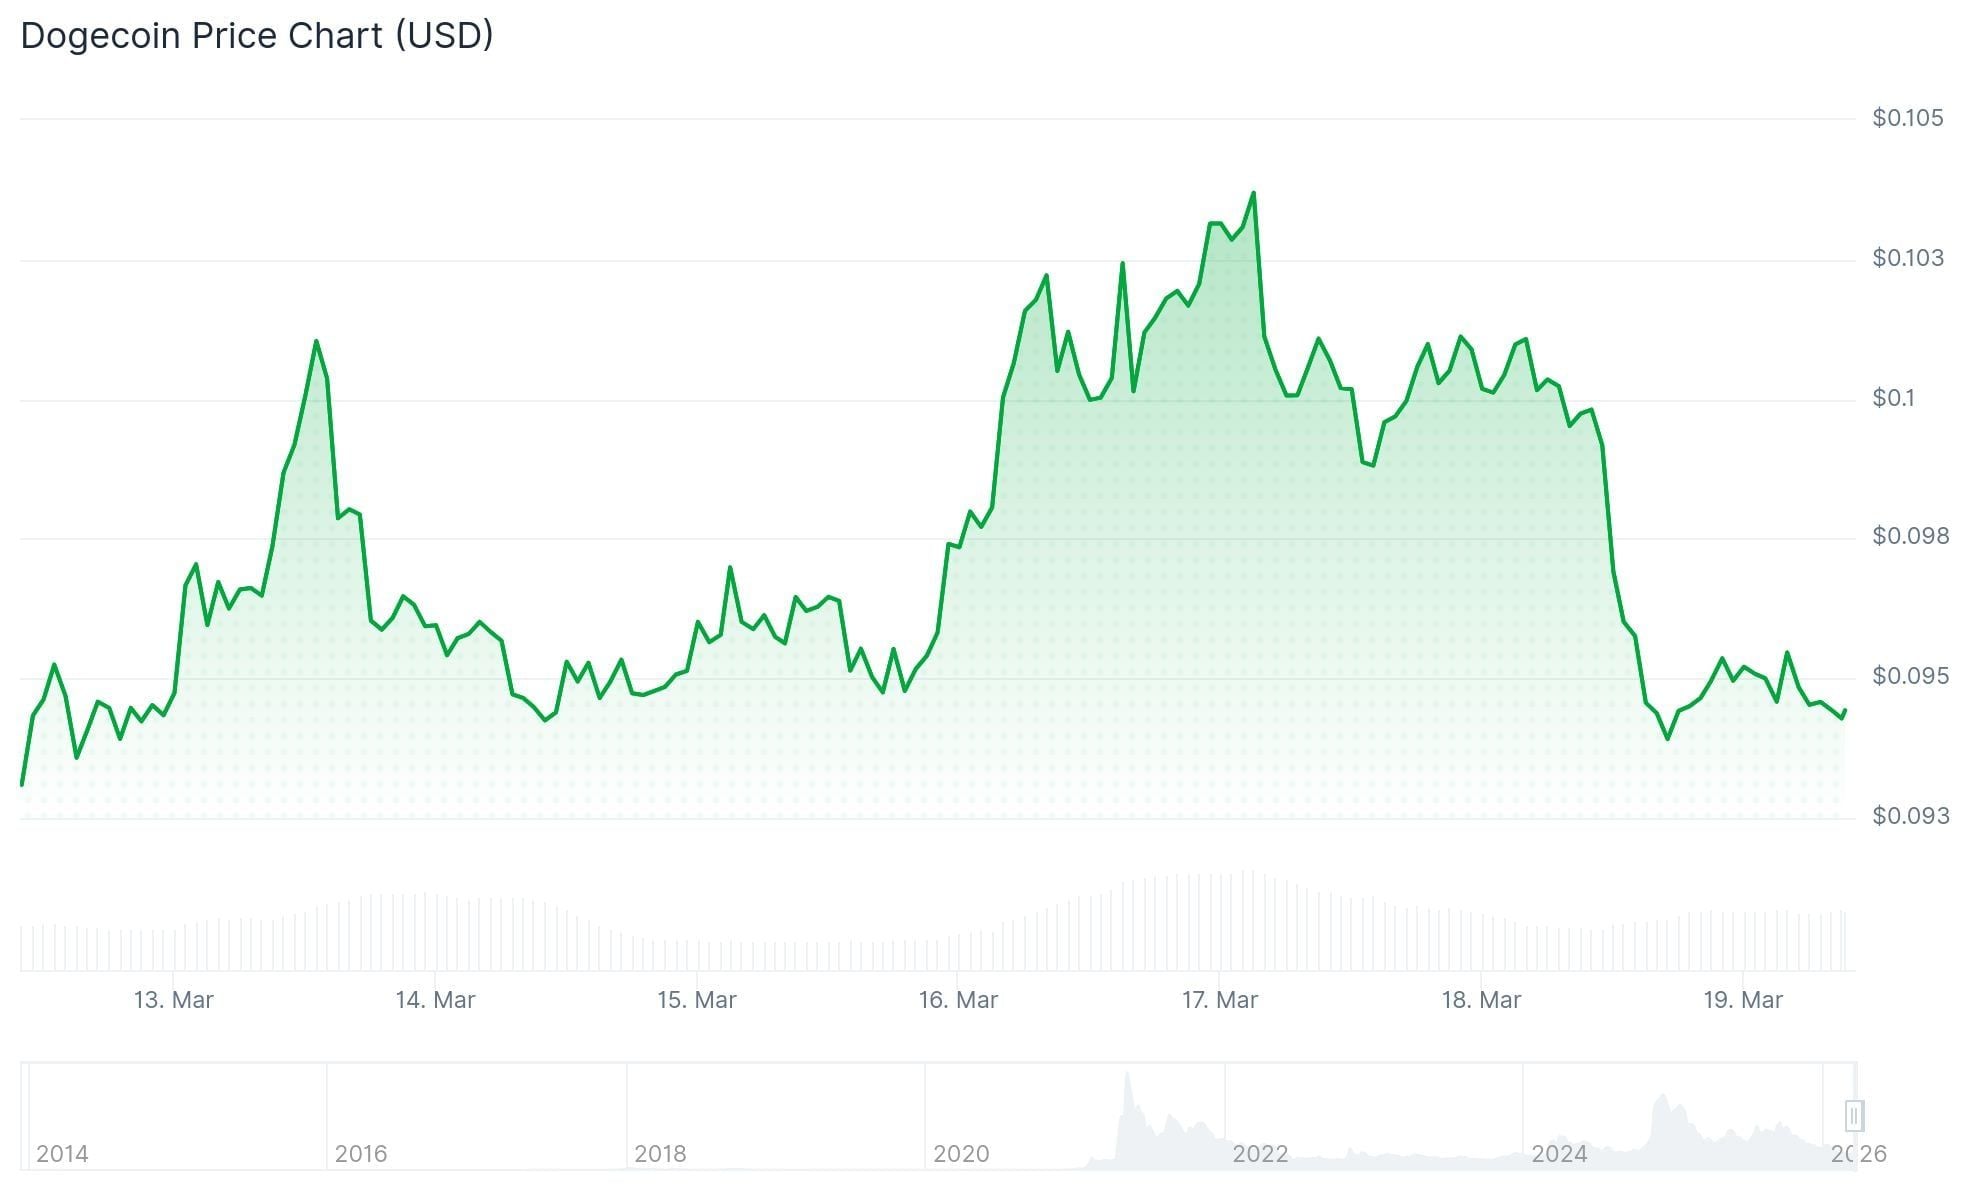
- As of March 18, DOGE was hovering around $0.094, reflecting a nearly 5% decline over the previous 24-hour period.
Dogecoin continues to consolidate in the vicinity of $0.10, forming a tightening pattern that has caught the eye of market participants. While historical precedent suggests this setup could lead to significant movement, the immediate outlook remains uncertain.
 Dogecoin (DOGE) Price
Analysis of the daily timeframe reveals DOGE is developing a classic falling wedge configuration. This technical structure occurs when an asset creates progressively lower peaks while the troughs converge upward. As this price channel narrows, it typically precedes a directional breakout. Long-term holders navigating this decline are anticipating an upward resolution.
This compression phase emerged following a pullback from earlier strong performance. Throughout this period, Dogecoin has established descending highs with diminishing selling intensity, indicating potential exhaustion among bearish market participants.
Overhead Resistance Remains Intact
The initial barrier blocking any meaningful bounce lies within the $0.105–$0.11 range. This zone aligns precisely with the 0.5 through 0.618 Fibonacci retracement measurements derived from the latest downward swing. Additionally, this region intersects with clustered short-duration exponential moving averages, creating a concentrated resistance barrier.
Dogecoin has repeatedly approached the $0.10 threshold throughout the past twelve months. On each occasion price pushed above this mark, selling pressure reemerged and drove values lower. Technical observers note this repeated rejection has eroded $0.10’s credibility as dependable support.
A decisive breach above $0.11 could pave the way toward $0.116, with $0.136 as the subsequent target. However, current positioning remains beneath the 50-, 100-, and 200-day moving average indicators, maintaining the prevailing bearish structure.
On March 18, Dogecoin was changing hands near $0.094, reflecting a 4.84% intraday decline.
Breaking the 50-Day EMA Remains Crucial
Even should DOGE successfully navigate past $0.11, the 50-day exponential moving average looms overhead and has shadowed the downward trajectory throughout the correction period. This dynamic indicator continuously adjusts with price action, making any breakthrough increasingly difficult to maintain.
From a historical perspective, successfully recapturing the 50-day EMA has consistently marked the initial legitimate indication of a trend transformation for DOGE. Absent this technical confirmation, market observers view any advance beyond $0.10 as temporary relief rather than meaningful reversal.
The Relative Strength Index has rebounded from deeply oversold readings and currently hovers near the neutral midpoint with modest bullish characteristics. The MACD indicator is similarly positioning for a possible bullish intersection, signaling that downward pressure may be waning.
Current market data confirms DOGE maintains its position above the longer-duration support foundation at $0.086, which marked the most recent localized bottom preceding the current stabilization attempt.
The post Dogecoin (DOGE) Forms Critical Falling Wedge Pattern as Traders Watch $0.10 Level appeared first on Blockonomi.


You May Also Like

Q2 Market Insights: Bitcoin regains dominance in risk-averse environment, ETFs remain critical to market structure

Nebius Revenue Skyrockets 684%: Why the "Pennsylvania AI Factory" Is the New Frontier for AI Infrastructure


