

MU Micron Technology Stock: Bullish Trend Intact as Post-Earnings Rally Shows Controlled Exhaustion

MU, Micron Technology Stock Analysis: 3 takeaways for This Week.
 EMA20, EMA50 and volume”
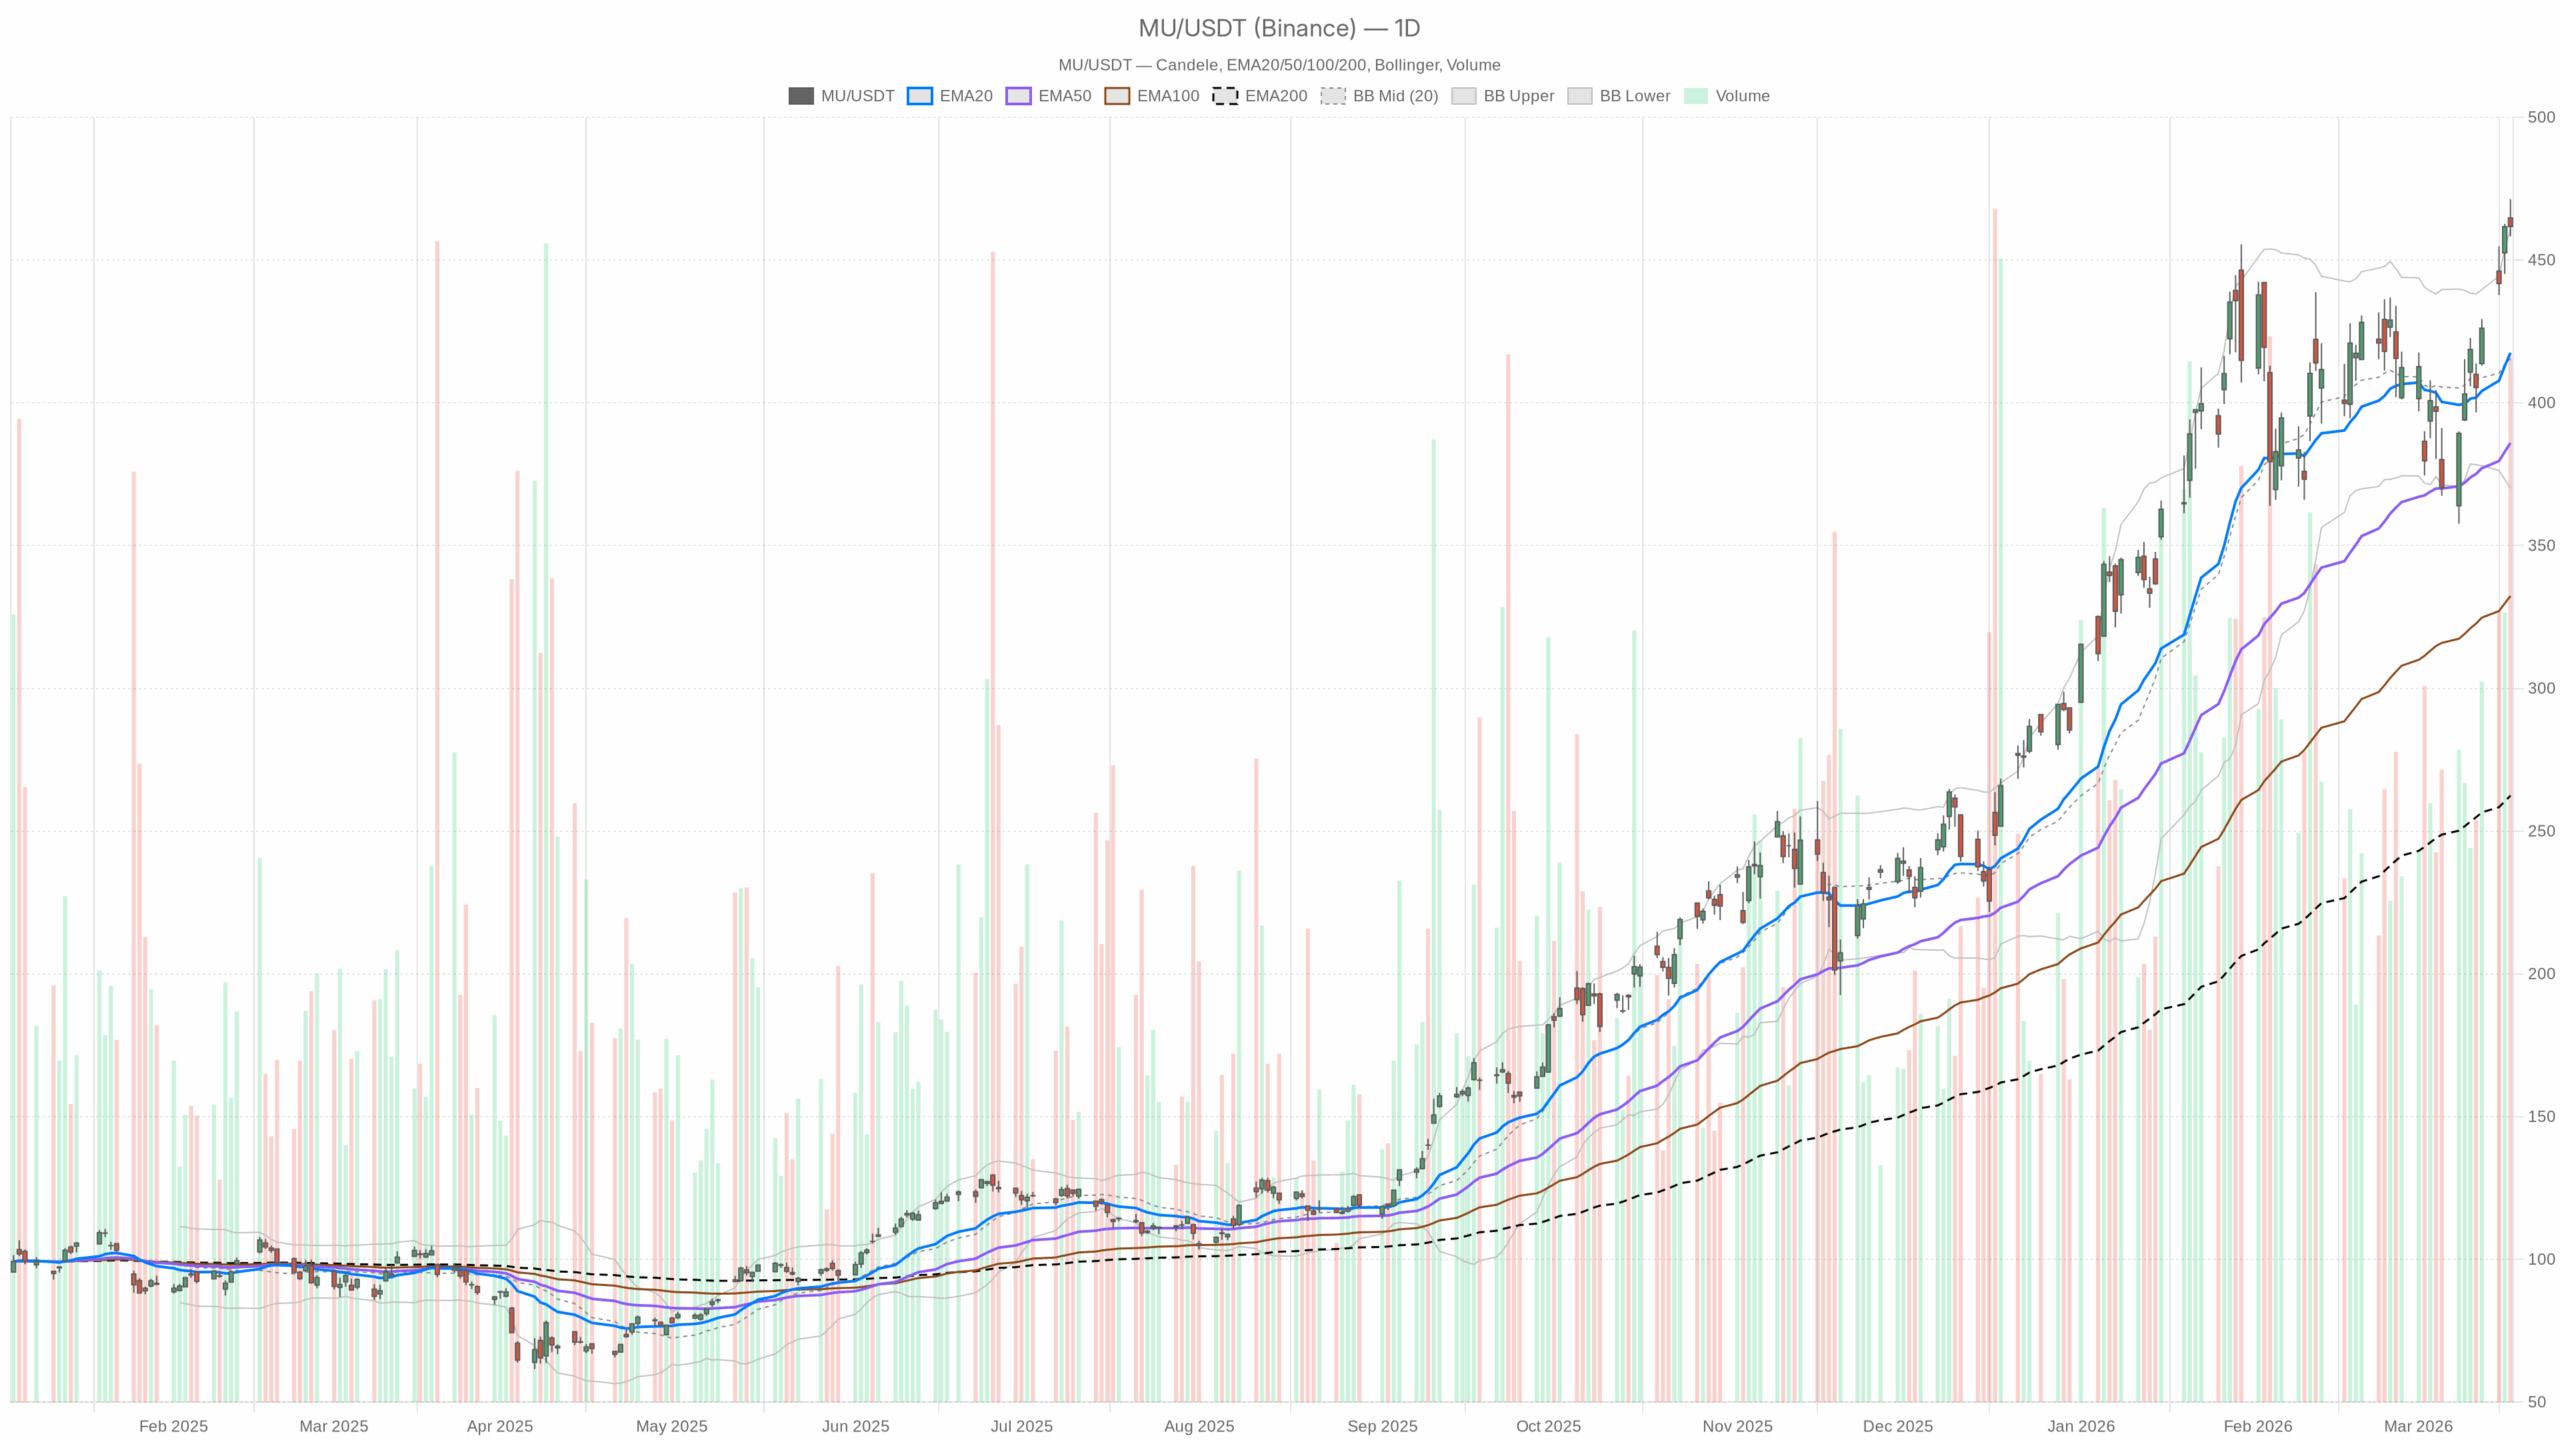
loading=”lazy” />MU — daily chart with candlesticks, EMA20/EMA50 and volume.
MU Micron Technology Stock After Earnings: Bullish but Showing Early Fatigue
MU Micron Technology stock remains in a strong bullish trend after its latest earnings surge, but the current tape signals controlled upside exhaustion rather than a clean continuation breakout.
Daily Chart: MU Micron Technology Stock Extended but Still Bullish
On the daily chart, MU closed at $461.73 on March 18, slipping modestly after tagging an intraday high of $471.34. That pullback came right around the upper Bollinger Band at $460.90. This tells us price has been pushing the top of its recent volatility envelope and is now reacting from an extended position. In plain terms, the stock is still strong, but no longer “cheap” relative to its own recent range.
Structurally, the daily trend is unambiguously positive. The 20‑day EMA at $417.53, the 50‑day EMA at $385.95, and the 200‑day EMA at $262.43 are all rising, with price trading well above each of them. This steep separation from the short- and medium‑term EMAs reflects an aggressive bullish trend that has already played out a substantial part of its move. It also implies that late buyers are paying a premium versus recent averages and that the risk of a sharp mean‑reversion spike increases if sentiment wobbles.
Daily Momentum and Volatility Context
Momentum on the daily timeframe still favors the bulls but is edging toward a more mature phase. The daily RSI at 64.25 sits just below the typical overbought zone. That level shows strong buying pressure, but not the kind of extreme that usually precedes immediate, sharp reversals. Meanwhile, the daily MACD line at 14 versus a signal line at 9.03 and a positive histogram of 4.98 confirm that upside momentum has been in control. However, MACD is now elevated, which often coincides with late‑stage trend extensions where new highs become harder to sustain without fresh catalysts.
Volatility is another important piece of this picture for MU Micron Technology stock. The daily ATR stands at 24.59, which is high relative to the stock’s price history and signals broad intraday swings. Elevated ATR after an earnings pop is consistent with a new information regime. Investors are rapidly repricing Micron’s AI‑driven growth story and forward guidance, creating wide ranges. For traders, this means a bullish bias, but with position sizing and risk limits needing more attention than usual.
Daily Pivot Levels and Fundamental Backdrop
The daily pivot levels help frame the immediate battlefield. The central pivot at $463.79 now sits just above the latest close. R1 at $469.28 aligns roughly with Tuesday’s intraday high, while S1 stands at $456.24. This configuration implies that the stock has tested resistance near R1 and then retreated just below the pivot. It points to a market that is still constructive but encountering enough selling interest at the highs to force a pause.
Fundamentally, recent news clearly leans bullish and explains the aggressive repricing in MU. Micron’s Q2 2026 earnings beat forecasts and Q3 guidance also came in ahead of expectations, with management highlighting strong AI‑related demand. Commentary describing an “AI super‑cycle” and discussions of MU trading at a forward P/E in the mid‑single digits relative to growth reinforce why buyers have crowded into the name. At the same time, intraday headlines note that the stock “slides” even as results and guidance beat. That intraday reaction shows expectations were already lofty and short‑term positioning was crowded on the long side, which can cap upside right after good news.
Hourly Chart: MU Rally Pauses, Not Reverses
Moving down to the 1‑hour chart, the technical picture still supports the daily bullish bias, but with more nuance. The latest 1‑hour candle shows MU closing at $461.84 after a session high of $468.68, mirroring the daily rejection near resistance. The 1‑hour 20‑EMA at $455.07, the 50‑EMA at $436.59, and the 200‑EMA at $412.23 are all rising beneath price. This intraday trend alignment confirms a strong uptrend is intact on shorter timeframes as well. It signals that, despite the intraday fade, buyers still dominate on dips.
Intraday Momentum and Volatility
However, the intraday momentum profile is starting to soften. The 1‑hour RSI at 65.08 is in bullish territory but not extreme. That reading shows demand is still healthy, yet the failure to push RSI into more stretched levels during the last drive to the highs hints at waning incremental strength. The 1‑hour MACD underlines that point. The MACD line at 10.66 has slipped just below its signal line at 11.6, leaving a negative histogram of ‑0.94. This minor bearish crossover does not break the trend, but it flags a short‑term momentum loss. It indicates that, on an hourly basis, the rally is pausing or transitioning into a consolidation phase rather than accelerating further immediately.
Hourly Bollinger Bands paint a similar picture of cooling enthusiasm in MU Micron Technology stock. The mid‑band sits at $457.15, with the upper band at $473.04 and the lower at $441.26. Price is now trading just above the mid‑band and well off the upper band. That location reflects a move from the upper volatility edge back toward the center of the range. It shows that volatility created by the earnings surprise is now being digested via sideways‑to‑down intraday action instead of a continuation spike.
The 1‑hour ATR at 6.36 remains elevated in absolute terms. That level confirms that intraday swings are still meaningful and that stops placed too close to the market risk getting triggered by normal noise. Combined with the hourly pivot at $464.04, R1 at $466.48 and S1 at $459.40, the message is clear: MU is bouncing around a relatively wide near‑term range, with sellers leaning near $466–$469 and buyers reappearing in the high‑$450s to low‑$460s.
15-Minute Chart: Tactical Neutrality Within a Bullish Structure
On the 15‑minute execution timeframe, conditions look more neutral and tactical. The most recent 15‑minute bar closed at $461.84 after failing to hold a brief push to $468.68. The 15‑minute 20‑EMA sits at $465.52, now above price, while the 50‑EMA is closer at $460.45 and the 200‑EMA lags down at $433.67. This alignment shows that, in the very short term, MU has slipped below its fast intraday average but still holds above the intermediate intraday trend. It reflects a pullback within an intraday uptrend, not a breakdown.
Short-Term Momentum and Micro Volatility
Short‑term momentum confirms this cooling. The 15‑minute RSI is at 43.4, just below the midpoint. That level indicates intraday selling pressure has taken the edge off the prior overextension but has not yet pushed the stock into oversold territory. In parallel, the 15‑minute MACD line at 1.07 sits below its signal line at 1.92, generating a negative histogram of ‑0.85. This bearish micro‑crossover shows that very short‑term momentum currently favors sellers. For active participants, it underscores that entries at the top of the recent intraday range are vulnerable to quick reversals.
Meanwhile, 15‑minute Bollinger Bands are tightening around price. The mid‑band is at $466.83, with the upper band at $470.51 and the lower at $463.16. MU is now trading just below the lower band after the sharp intraday pullback. This tells us the stock briefly overshot on the downside within that micro‑range. It also hints that, absent fresh negative news, the 15‑minute timeframe may soon see a bounce or at least a pause in selling as volatility compresses again.
Notably, the 15‑minute pivot structure mirrors the hourly levels, with a pivot at $464.04, R1 at $466.48, and S1 at $459.40. The stock is currently trading between the pivot and S1. That positioning encapsulates the short‑term conflict: the higher‑timeframe trend in MU Micron Technology stock is bullish, but execution right now is happening from a mildly pressured area closer to intraday support.
Multi-Timeframe View: Same Trend, Different Phase
Putting this all together, the timeframes do not contradict each other, but they do describe different stages of the same move. The daily and hourly charts both show a robust uptrend in MU, supported by strong earnings, upbeat guidance and the broader AI memory demand narrative. However, the hourly MACD rollover and 15‑minute neutral regime show the current phase is a digestion of gains rather than a fresh breakout. The conflict is not directional; it is about timing. Higher timeframes favor further upside over weeks and months, while the very short term signals that the stock may need more time to consolidate recent gains.
Key Scenarios for MU Micron Technology Stock
Constructive Bullish Consolidation Scenario
From here, the constructive scenario for MU is a bullish consolidation above key support areas. On the daily chart, holding above the central pivot at $463.79 and especially above S1 at $456.24 would argue for a healthy pause rather than a trend failure. A renewed push back through $469–$471, with daily RSI pushing toward or slightly above 70 and MACD maintaining its positive profile, would indicate buyers have digested the earnings surge and are ready to price in more of the AI growth story.
On the hourly chart, the bullish case would be helped by MACD turning back up and RSI holding above 50 on pullbacks. That pattern would reflect shallow dips being absorbed quickly by demand. In that setup, MU Micron Technology stock would likely remain in an uptrend while working off its overextension through time rather than deep price damage.
Deeper Mean-Reversion and Cautious Path
In contrast, the bearish, or at least more cautious, scenario centers on a deeper mean‑reversion move. A sustained break below hourly and 15‑minute support around $459–$456, especially on expanding volume and a rising ATR, would signal that post‑earnings profit‑taking is more intense than a standard consolidation. If daily RSI then rolls over decisively toward the 50 area and price falls back toward the 20‑day EMA near $417, the message would shift from “cooling” to “reversion.”
Under that path, the bullish thesis would not necessarily die, but its timeframe would extend and risk‑reward for fresh longs would look less attractive until a new base forms. Overall, MU Micron Technology stock remains in a powerful uptrend, backed by strong earnings, optimistic AI demand commentary, and broad technical confirmation on the daily and hourly charts. At the same time, elevated volatility, stretched distances from key EMAs, and short‑term momentum rollovers argue for more two‑sided trade in the near term. Positioning around this name now revolves less around guessing the long‑term direction and more around managing entries and risk within a still‑bullish but increasingly volatile environment.


You May Also Like

Australian Dollar Dips as US Retail Sales Data Meets Forecasts, Dampening Rate Cut Hopes

Web3 Gaming Has a Visibility Problem, Not a Funding Problem


