

Gold Price Plummets Below $4,650 as Inflation Fears and Liquidity Crunch Trigger Market Panic
BitcoinWorld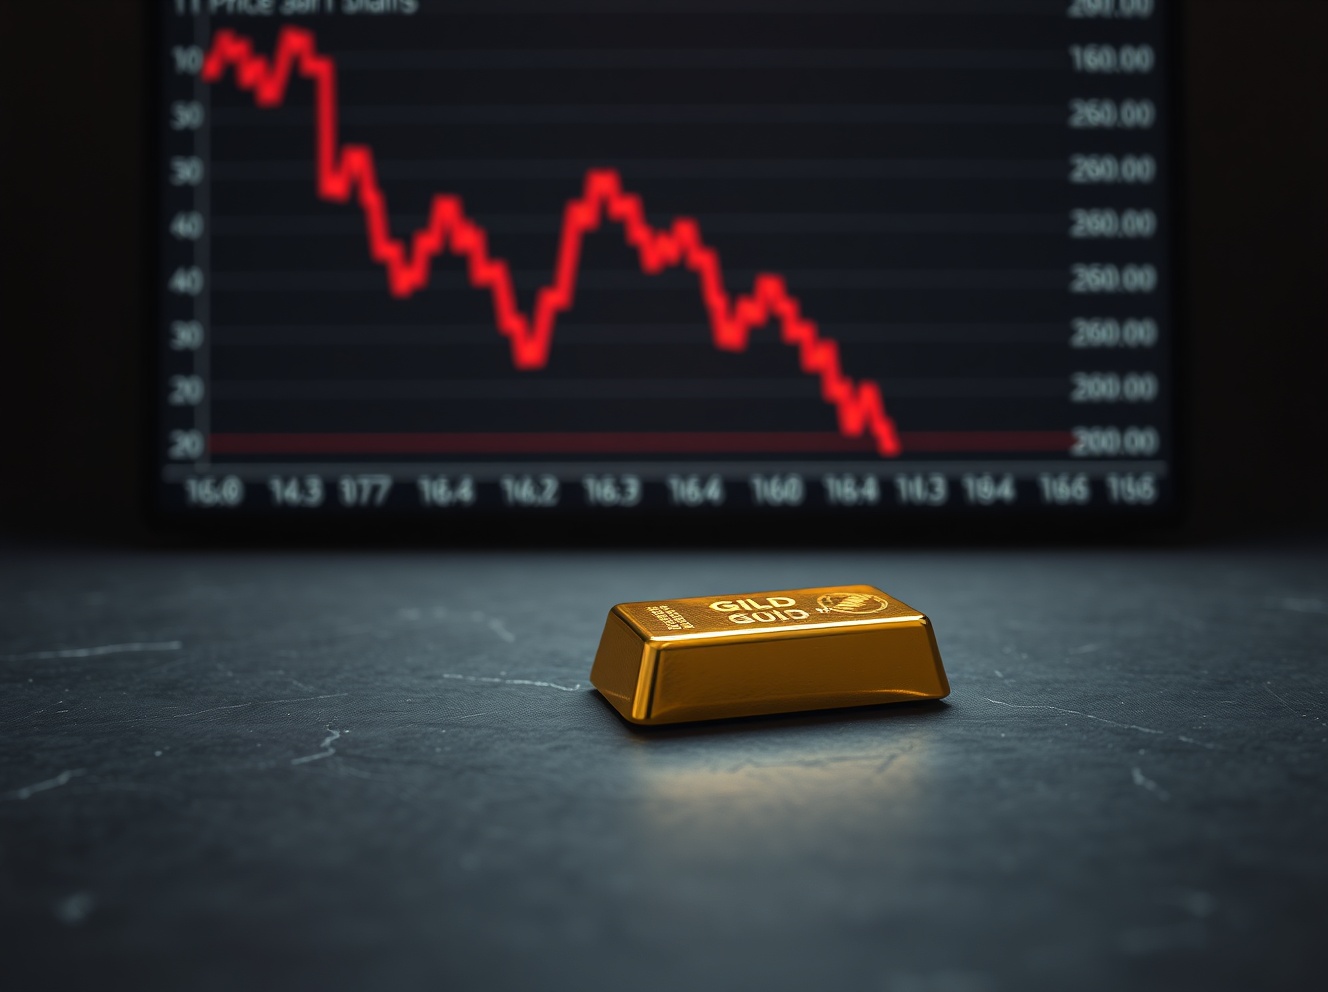
Gold Price Plummets Below $4,650 as Inflation Fears and Liquidity Crunch Trigger Market Panic
Global gold markets experienced a significant sell-off this week, with the precious metal’s price tumbling decisively below the critical $4,650 per ounce threshold. This sharp decline, observed in major financial hubs from London to New York, reflects a potent combination of renewed inflation anxieties and a tightening of global financial liquidity. Consequently, analysts are scrutinizing charts and data to understand the underlying pressures reshaping the traditional safe-haven asset’s trajectory.
Gold Price Breaks Key Support Level
The descent below $4,650 marks a pivotal technical and psychological breach for the gold market. This level had previously acted as a strong support zone throughout the latter half of 2024. Market charts now illustrate a clear bearish trend, with successive lower highs and lower lows forming over the past month. The sell-off accelerated following the latest economic data releases, which failed to reassure investors about the trajectory of consumer prices. Trading volumes spiked dramatically during the decline, indicating broad-based participation from institutional funds and algorithmic traders. Furthermore, this move has pushed gold into oversold territory according to several momentum indicators, potentially setting the stage for a volatile rebound or consolidation phase.
Inflation Data Fuels Persistent Market Fears
Despite central banks’ prolonged efforts, recent inflation reports have undermined confidence in a swift return to target levels. Core inflation metrics, which exclude volatile food and energy prices, have proven particularly stubborn. This persistence suggests that underlying price pressures remain embedded in the service sector and wage growth. As a result, market expectations for imminent central bank interest rate cuts have been pushed further into the future. Higher-for-longer interest rate expectations increase the opportunity cost of holding non-yielding assets like gold. Therefore, investors are reallocating capital towards fixed-income securities that now offer more attractive real yields after adjusting for inflation.
The Liquidity Squeeze Explained
Simultaneously, a tightening of global dollar liquidity is applying additional downward pressure on gold and other commodities. Several factors contribute to this squeeze. First, major central banks continue to reduce their balance sheets through quantitative tightening programs, effectively withdrawing liquidity from the financial system. Second, strong demand for U.S. Treasury securities is absorbing available capital. Third, stress in key funding markets has prompted a more cautious stance from prime brokers and lenders. This liquidity drain forces leveraged market participants to sell liquid assets to cover margins and meet obligations. Gold, being a highly liquid global asset, often faces selling in such environments despite its traditional safe-haven status.
Comparative Analysis of Precious Metals
The sell-off has not been uniform across the precious metals complex. A brief comparison reveals divergent performances:
- Gold: Down approximately 8% over the past month, showing high sensitivity to real yields and dollar strength.
- Silver: Experiencing even steeper declines, down over 12%, due to its dual role as both a monetary and industrial metal suffering from economic growth concerns.
- Platinum: Displaying relative resilience, down only 5%, supported by constrained supply and sustained automotive demand.
- Palladium: Remains volatile but range-bound, heavily influenced by specific automotive sector dynamics.
This disparity highlights how gold’s driver is primarily financial, whereas other metals contend with additional fundamental supply-demand factors.
Historical Context and Chart Patterns
Examining historical gold price charts provides crucial context for the current move. The rally that peaked earlier in 2024 mirrored patterns seen in previous inflationary cycles, such as the late 1970s. However, the subsequent correction also finds parallels, particularly when central banks shift from accommodative to restrictive policy. Technical analysts note that the current chart structure resembles a head-and-shoulders top pattern that formed over several months, with the break below $4,650 confirming the pattern’s bearish prediction. Key Fibonacci retracement levels from the 2023-2024 rally now become important potential support zones for traders monitoring the next leg of the price action.
Central Bank Gold Reserves: A Stabilizing Factor?
Despite the price weakness, reports indicate that official sector demand from central banks remains a steady underlying support. Many central banks, particularly in emerging markets, continue their long-term strategy of diversifying reserves away from the U.S. dollar. Their purchases are typically less sensitive to short-term price fluctuations and more focused on strategic allocation. This consistent demand from large, price-insensitive buyers can help establish a floor under the market during periods of speculative selling. Data from the World Gold Council confirms that central bank net purchases, while moderating from record highs, remain positive on a quarterly basis.
Impact on Mining Equities and ETFs
The drop in the underlying commodity has sent shockwaves through related investment vehicles. Gold mining equities, as represented by major indices, have fallen more sharply than the metal itself—a phenomenon known as negative leverage, where mining costs remain fixed while revenue falls. Meanwhile, physically backed gold exchange-traded funds (ETFs) have reported consistent outflows over the past several weeks. These outflows represent the direct selling of bullion from fund vaults to meet shareholder redemptions, creating a self-reinforcing cycle of physical supply hitting the market. Retail investor sentiment, as measured by various surveys, has also turned notably bearish in the short term.
Expert Analysis on Future Trajectory
Market strategists offer a spectrum of views on the path ahead. Some analysts argue the sell-off is overdone, pointing to still-elevated geopolitical risks and structural deglobalization trends that should support long-term gold demand. Others maintain that the primary macro drivers—real interest rates and dollar strength—remain firmly bearish for the metal in the near term. The consensus suggests that a sustained recovery for gold likely requires either a clear peak in the interest rate cycle or a sudden escalation in geopolitical risk that triggers a flight to safety. For now, the charts suggest traders are preparing for continued volatility and range-bound trading between new support and resistance levels.
Conclusion
The gold price breaking below $4,650 serves as a stark indicator of shifting macroeconomic winds. The convergence of persistent inflation fears, which delay monetary easing, and a tangible global liquidity squeeze has overwhelmed the metal’s traditional safe-haven appeal. While strategic buyers like central banks may provide a long-term foundation, the short-term technical and fundamental picture, as reflected in market charts, remains challenging. Investors and analysts will now watch for stabilization around new support levels and any signs of a pivot in the dominant narrative driving this significant gold price correction.
FAQs
Q1: Why is gold falling if inflation is still a concern?
Gold typically benefits from inflation fears when they are accompanied by expectations of loose monetary policy. Currently, high inflation is leading markets to expect sustained high interest rates, which increase the opportunity cost of holding gold, a non-yielding asset. This dynamic is outweighing its inflation-hedge characteristic.
Q2: What is a liquidity squeeze and how does it affect gold?
A liquidity squeeze occurs when access to cash and funding in the financial system becomes more difficult and expensive. It forces investors and institutions to sell their most liquid assets (like gold) to raise cash, creating downward price pressure even if the asset’s long-term fundamentals are sound.
Q3: What key chart level should traders watch now?
With the $4,650 support broken, technical analysts are now looking toward the next major support zone around $4,500-$4,520, which aligns with the 200-week moving average and a 50% Fibonacci retracement of the previous major rally.
Q4: Are central banks still buying gold during this drop?
Yes, reports and data from institutions like the World Gold Council indicate that central bank purchases, while potentially slower, have continued. Their buying is often strategic and long-term, aimed at reserve diversification, making them less sensitive to short-term price swings.
Q5: How does this drop compare to other major gold corrections?
In terms of magnitude, the current correction is significant but within historical norms for bull market pullbacks. The pace of the decline has been rapid, similar to corrections driven by sharp moves in real yields and the U.S. dollar, such as those seen in 2013 and 2021.
This post Gold Price Plummets Below $4,650 as Inflation Fears and Liquidity Crunch Trigger Market Panic first appeared on BitcoinWorld.


You May Also Like

Analyst Says This Chart Is Basically Doing What XRP Did In 2021

Prediction markets get CFTC relief as legal battles widen


