

XRP Price: Is the 10% Dip a Buying Signal? Whales and Korean Traders Think So
TLDR
- XRP dropped 10.5% over three days but is holding a bull flag breakout near the $1.40–$1.45 support zone
- Korean traders are withdrawing XRP from Upbit exchange at record pace, a pattern linked to past accumulation phases
- Whale flows turned positive for the first time since early 2024, suggesting large holders may be shifting to accumulation
- The Federal Reserve held interest rates at 3.5%–3.75% on March 18, weighing on risk assets including crypto
- US-listed XRP spot ETFs recorded zero net inflows on Wednesday, with cumulative inflows sitting at $1.21 billion
XRP is trading around $1.42–$1.45 after a sharp three-day pullback of over 10%. The drop came alongside broader crypto market weakness, but several on-chain signals are pointing toward a possible recovery setup.
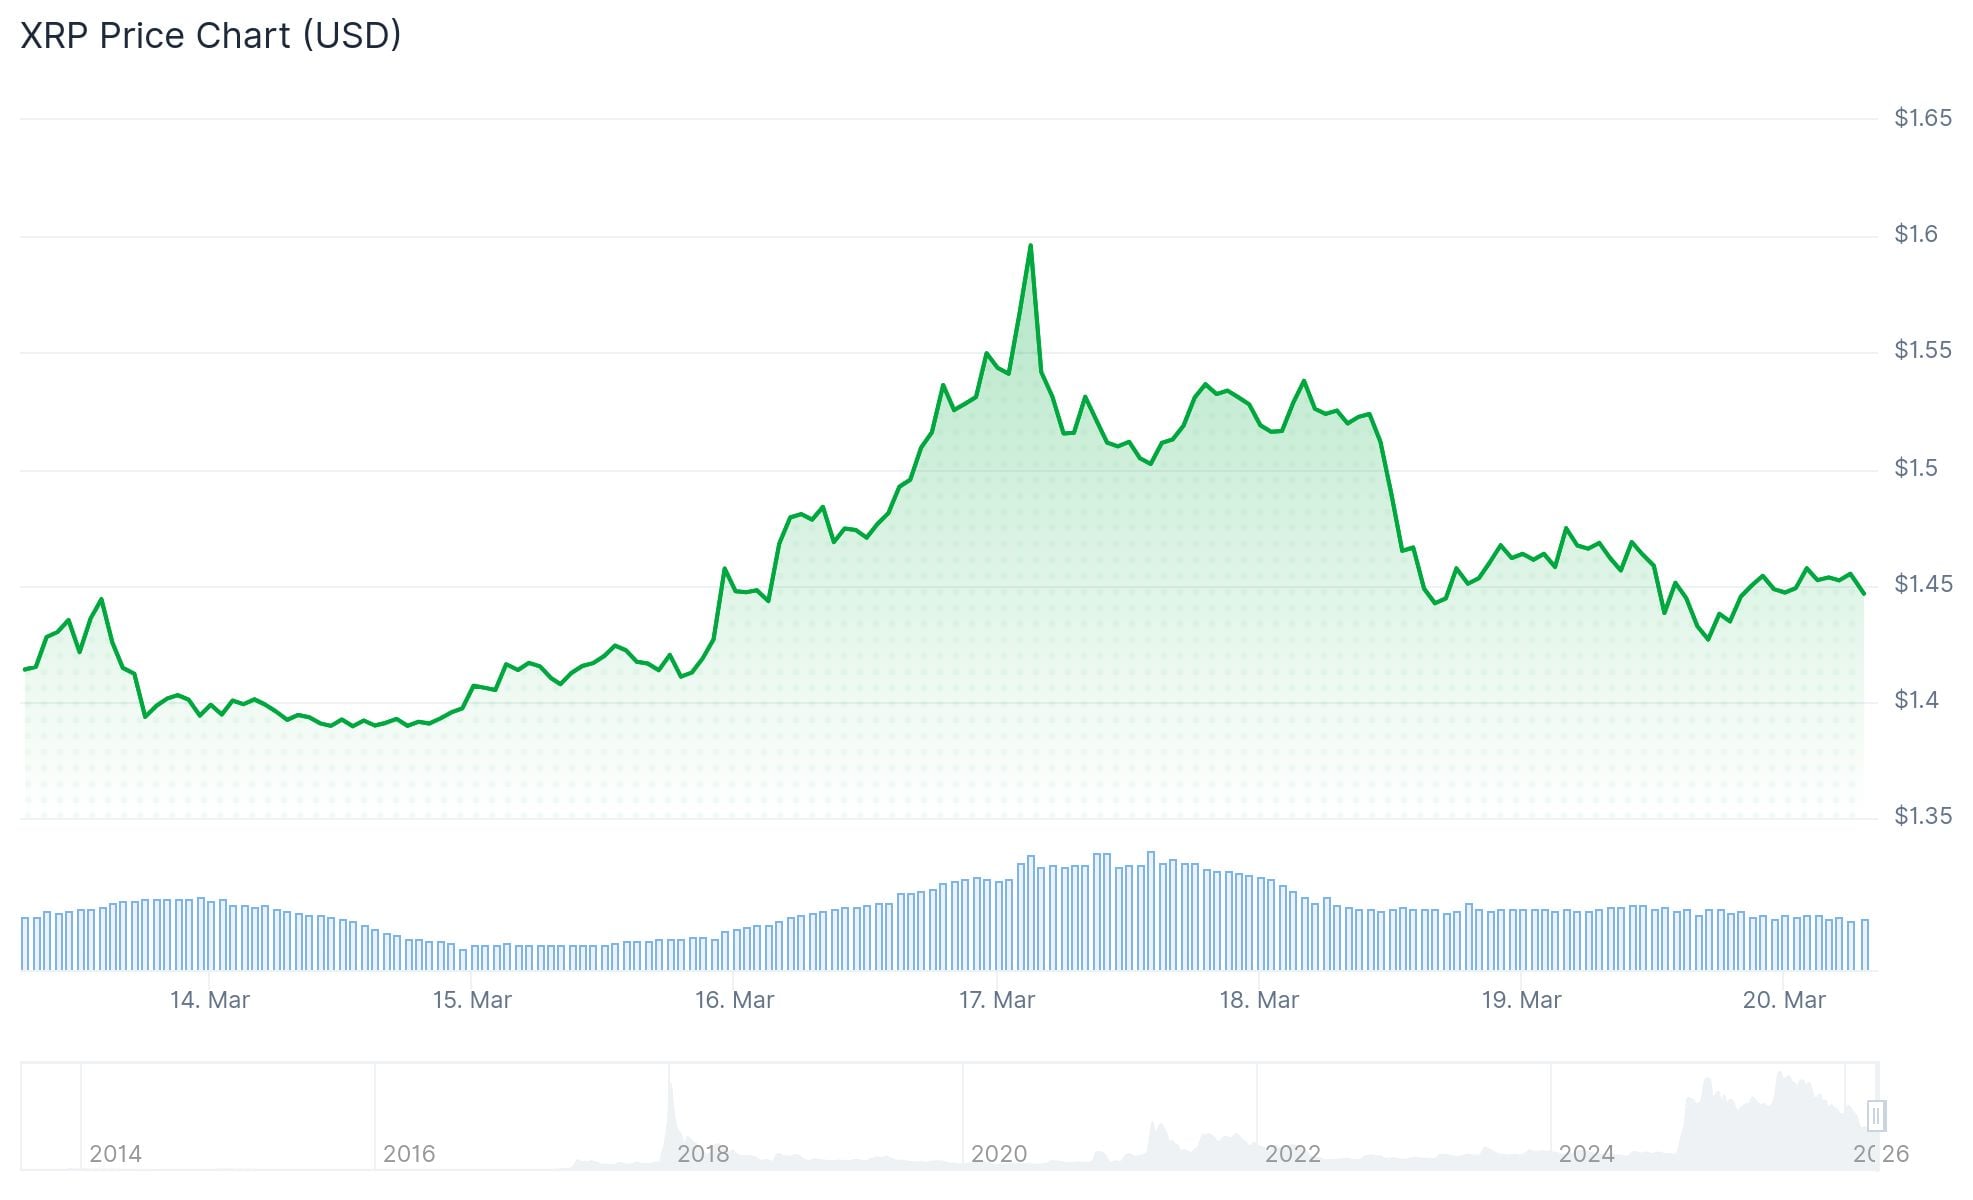 XRP Price
The price decline follows a breakout from a bull flag pattern last week. In technical analysis, a bull flag forms when price consolidates in a downward channel after a strong rally. After breaking above that channel, price often pulls back to test the former resistance level as new support — which is what appears to be happening now.
The key support zone sits in the mid-$1.40s, which also lines up with the 20-day exponential moving average. If XRP holds above this level, the bull flag’s measured target sits near $1.70–$1.72, about 20% above current prices.
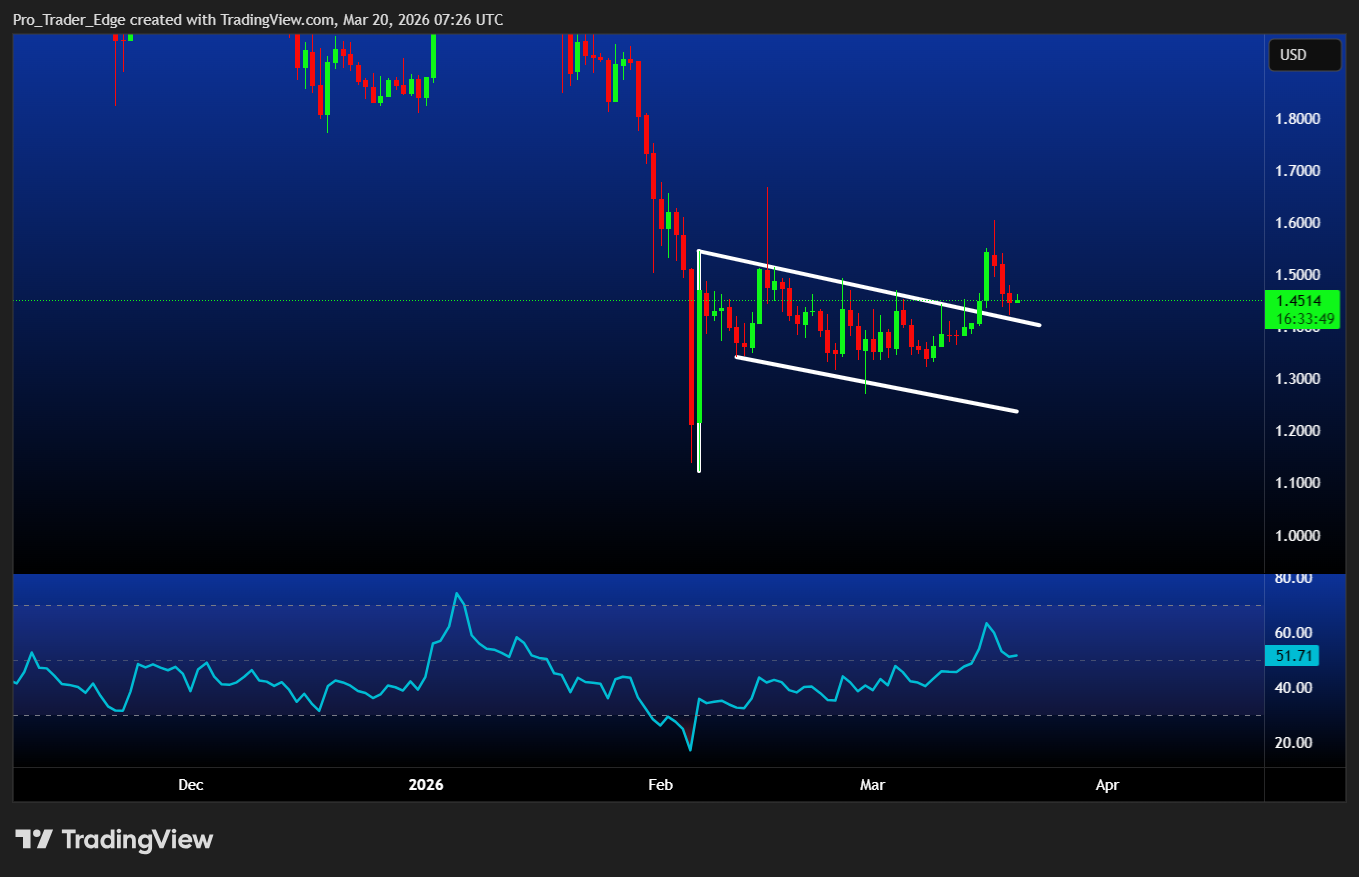 Source: TradingView
Record Korean Exchange Outflows
On-chain data from CryptoQuant shows a surge in XRP withdrawals from South Korea’s Upbit exchange since December 2025. Wallets across nearly all size groups have been pulling XRP off the exchange at a record pace. Fewer coins sitting on exchanges typically means less immediate sell pressure.
 Source: CryptoQuant
On-chain analyst CW noted a similar pattern between 2021 and early 2023, when elevated Korean exchange withdrawals coincided with an accumulation phase. That period preceded a rally from below $1 to above $3 — a rise of roughly 500%.
As of Thursday, XRP trades in South Korean Won were the fourth-largest market by 24-hour volume on CoinMarketCap.
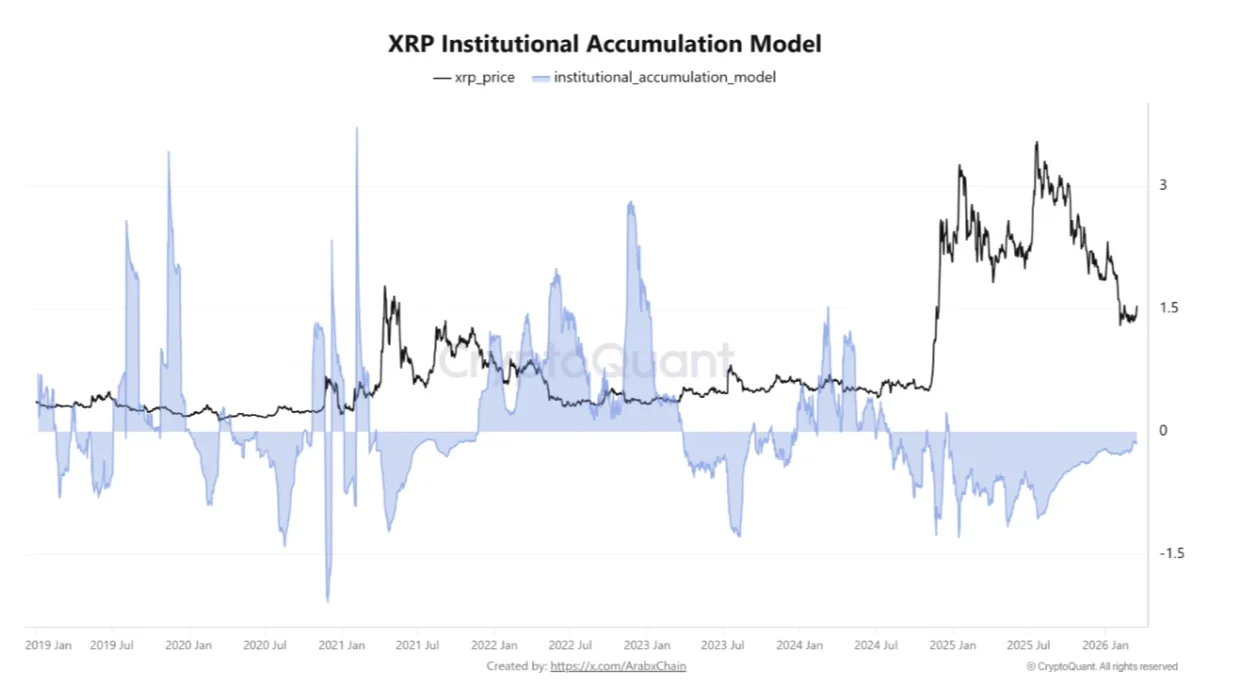
Whale Activity Shifts Positive
XRP’s 90-day average whale flow has turned positive for the first time after staying negative for most of 2024 and early 2025. During that negative period, large holders were consistently selling. The latest shift suggests that aggressive distribution may be slowing down.
A similar transition occurred during April–September 2025, when XRP climbed from around $2.20 to $3.55.
On the macro side, the Federal Reserve held interest rates steady at 3.5%–3.75% on March 18, citing ongoing inflation pressures and geopolitical instability. Markets treated this as a restrictive signal. The CMC Crypto Fear and Greed Index read 29 at time of writing, indicating elevated fear.
Institutional participation remains subdued. US-listed XRP spot ETFs saw zero net inflows on Wednesday. Assets under management stand at approximately $1.02 billion, against cumulative inflows of $1.21 billion.
 Source: CryptoQuant
According to CoinGlass liquidation data, a cluster of liquidity sits near $1.35. A break below current support could trigger forced liquidations in that zone.
On the four-hour chart, XRP showed a bearish MACD crossover near the $1.54 resistance level. Bulls would need a reclaim of $1.50 to begin rebuilding momentum, with $1.55 seen as the next key level before a potential run toward $1.60.
The post XRP Price: Is the 10% Dip a Buying Signal? Whales and Korean Traders Think So appeared first on CoinCentral.


You May Also Like

U.S. Approves Alibaba and Tencent to Buy Nvidia H200 AI Chips

Prediction markets get CFTC relief as legal battles widen


