The Bitcoin price action has long been used as the standard measurement of its market cycle. While price has served as a convenient benchmark, a crypto analyst argues that it may not be the most reliable tool for understanding the cycle. Instead, his analysis points to a stronger factor that could serve as a better […]The Bitcoin price action has long been used as the standard measurement of its market cycle. While price has served as a convenient benchmark, a crypto analyst argues that it may not be the most reliable tool for understanding the cycle. Instead, his analysis points to a stronger factor that could serve as a better […]

Bitcoin Price Is Not The Best Way To Measure The Cycle; Pundit Reveals A Stronger Factor

The Bitcoin price action has long been used as the standard measurement of its market cycle. While price has served as a convenient benchmark, a crypto analyst argues that it may not be the most reliable tool for understanding the cycle. Instead, his analysis points to a stronger factor that could serve as a better framework for measuring Bitcoin’s market cycle. 

Time Proves More Reliable Than Bitcoin Price 

Bitcoin enthusiasts often focus on price as the ultimate measure of progress in a market cycle, but crypto analyst Christian Chifoi has presented a different perspective that challenges conventional thinking. In his latest analysis on X social media, Chifoi explained that focusing solely on BTC’s four-year cycle or short-term gains is like watching the market through a narrow lens. He argues that the true driver of the cryptocurrency’s trajectory is not price but time. 

By examining Bitcoin’s historical movements, Chifoi emphasized that the market follows a structural rhythm that goes beyond mere price action. He noted the significance of the “SHMITA years,” pointing to 2014-2015 and 2021-2022 as pivotal moments in the cryptocurrency’s history. 

Bitcoin

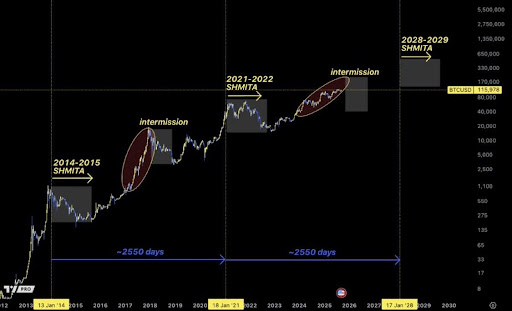
By his calculations, the next major inflection is expected around 2028/2029, occurring at a 2,550-day interval. This framework places great emphasis on time as the primary variable, while price is simply a reflection that unfolds after the passage of time. In Chifoi’s view, “time > price” is the correct equation for compounding wealth over multiple cycles. 

Looking ahead, the analyst sees two possible scenarios for Bitcoin’s next major move. The first possibility is an early blow-off top in 2028, followed by a sharp cyclical correction. The alternative scenario mirrors the 2021 cycle, where BTC peaked early in the year, then went through a prolonged distribution phase lasting 8-10 months. While it remains uncertain which outcome will play out, Chifoi stressed that “time will show the price,” underscoring that the intermissions between cycles are just as crucial as the market tops and bottoms.

Preparing For The Next Altcoin Season

Beyond Bitcoin, Chifoi strongly emphasized the altcoin market in his analysis. The crypto analyst predicts the market could experience another explosive altcoin season in the 2028/2029 window. However, he also cautioned that the market could undergo a necessary cleansing phase before the altcoin season arrives. This shakeout period, or “intermission,” is expected to eliminate weaker projects, leaving space for stronger, more resilient altcoins to dominate the next cycle. 

To prepare for this, Chifoi revealed his personal strategy of maintaining 20% of his holdings in cash while gradually building his positions further during the intermission phase. His reasoning is rooted in the same principle of prioritizing time over price when measuring the Bitcoin market cycle. By positioning early, the market expert believes that investors could maximize their exposure to the next major cycle without exhausting themselves in short-term market chases.

Bitcoin
Market Opportunity
Notcoin Logo
Notcoin Price(NOT)
$0.000555
$0.000555$0.000555
+3.54%
USD
Notcoin (NOT) Live Price Chart
Disclaimer: The articles reposted on this site are sourced from public platforms and are provided for informational purposes only. They do not necessarily reflect the views of MEXC. All rights remain with the original authors. If you believe any content infringes on third-party rights, please contact [email protected] for removal. MEXC makes no guarantees regarding the accuracy, completeness, or timeliness of the content and is not responsible for any actions taken based on the information provided. The content does not constitute financial, legal, or other professional advice, nor should it be considered a recommendation or endorsement by MEXC.

You May Also Like

Microsoft Corp. $MSFT blue box area offers a buying opportunity

Microsoft Corp. $MSFT blue box area offers a buying opportunity

The post Microsoft Corp. $MSFT blue box area offers a buying opportunity appeared on BitcoinEthereumNews.com. In today’s article, we’ll examine the recent performance of Microsoft Corp. ($MSFT) through the lens of Elliott Wave Theory. We’ll review how the rally from the April 07, 2025 low unfolded as a 5-wave impulse followed by a 3-swing correction (ABC) and discuss our forecast for the next move. Let’s dive into the structure and expectations for this stock. Five wave impulse structure + ABC + WXY correction $MSFT 8H Elliott Wave chart 9.04.2025 In the 8-hour Elliott Wave count from Sep 04, 2025, we saw that $MSFT completed a 5-wave impulsive cycle at red III. As expected, this initial wave prompted a pullback. We anticipated this pullback to unfold in 3 swings and find buyers in the equal legs area between $497.02 and $471.06 This setup aligns with a typical Elliott Wave correction pattern (ABC), in which the market pauses briefly before resuming its primary trend. $MSFT 8H Elliott Wave chart 7.14.2025 The update, 10 days later, shows the stock finding support from the equal legs area as predicted allowing traders to get risk free. The stock is expected to bounce towards 525 – 532 before deciding if the bounce is a connector or the next leg higher. A break into new ATHs will confirm the latter and can see it trade higher towards 570 – 593 area. Until then, traders should get risk free and protect their capital in case of a WXY double correction. Conclusion In conclusion, our Elliott Wave analysis of Microsoft Corp. ($MSFT) suggested that it remains supported against April 07, 2025 lows and bounce from the blue box area. In the meantime, keep an eye out for any corrective pullbacks that may offer entry opportunities. By applying Elliott Wave Theory, traders can better anticipate the structure of upcoming moves and enhance risk management in volatile markets. Source: https://www.fxstreet.com/news/microsoft-corp-msft-blue-box-area-offers-a-buying-opportunity-202509171323
Share
BitcoinEthereumNews2025/09/18 03:50
WTI drifts higher above $59.50 on Kazakh supply disruptions

WTI drifts higher above $59.50 on Kazakh supply disruptions

The post WTI drifts higher above $59.50 on Kazakh supply disruptions appeared on BitcoinEthereumNews.com. West Texas Intermediate (WTI), the US crude oil benchmark
Share
BitcoinEthereumNews2026/01/21 11:24
MYX Finance price surges again as funding rate points to a crash

MYX Finance price surges again as funding rate points to a crash

MYX Finance price went parabolic again as the recent short-squeeze resumed. However, the formation of a double-top pattern and the funding rate point to an eventual crash in the coming days. MYX Finance (MYX) came in the spotlight earlier this…
Share
Crypto.news2025/09/18 02:57