

Bitcoin’s Yearly Average Price Shows the Bigger Picture Behind Market Cycles
Short-term price moves often dominate market attention, but the bigger trend becomes clearer when looking at longer time frames.
When Bitcoin is viewed through yearly average prices instead of daily volatility, a clear pattern emerges – the market moves in cycles, but each cycle has historically pushed the average price significantly higher than the previous one.
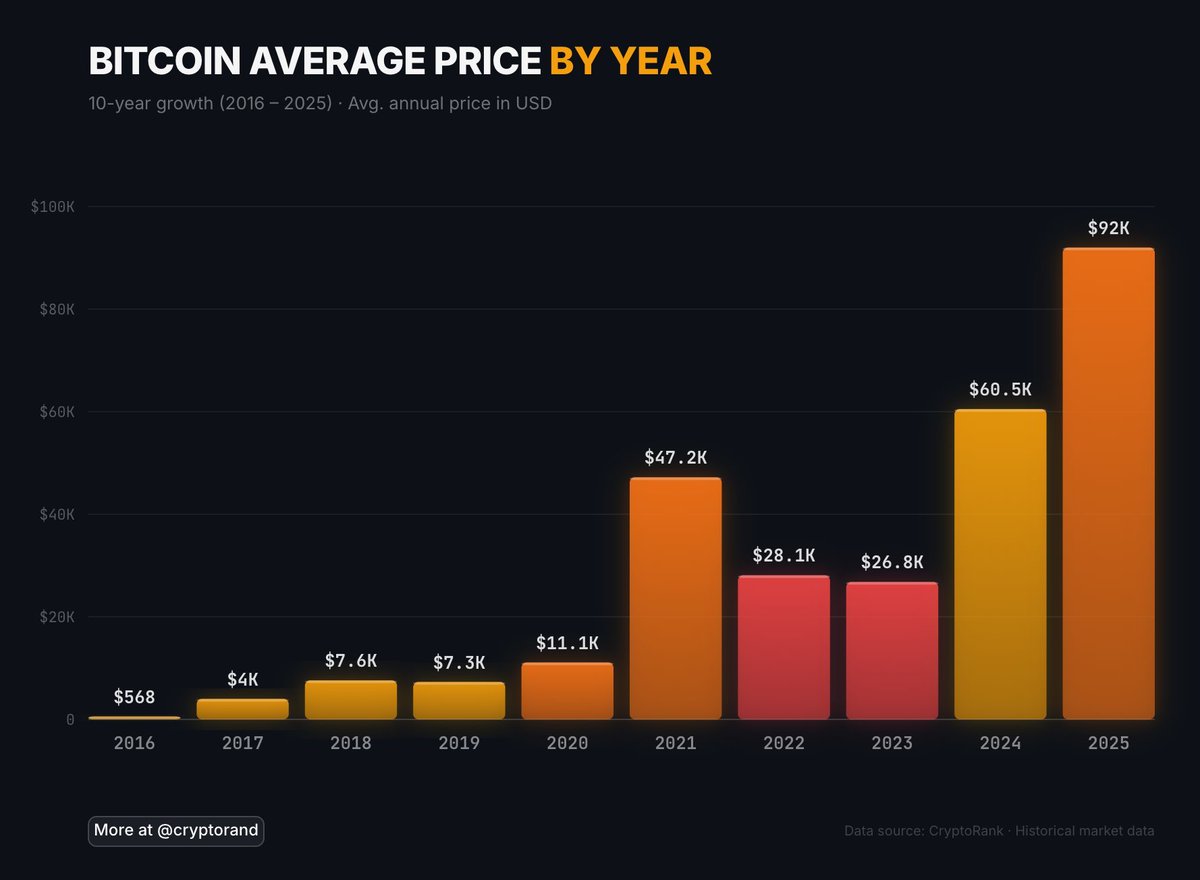
The yearly average price data from 2016 to 2025 shows how Bitcoin has evolved from a sub-$1,000 asset into a market where yearly averages are now measured in tens of thousands of dollars.
Early Years: From Hundreds to Thousands
In 2016, Bitcoin’s average price was just $568, reflecting how early the market still was at the time. The following year saw a major expansion, with the average price rising to around $4,000 in 2017.
The upward momentum continued into 2018, when the average price reached $7,600, before stabilizing slightly in 2019 at around $7,300. This period showed the first major cycle where rapid growth was followed by a consolidation phase.
By 2020, the average yearly price had climbed to $11,100, setting the stage for the next major market expansion.
Expansion and Market Peak Years
The biggest jump in the entire chart came in 2021, when Bitcoin’s average price surged to approximately $47,200. This marked one of the strongest expansion periods in the market cycle, where the yearly average moved dramatically higher compared to previous years.
However, the following period showed a clear market correction. In 2022, the average Bitcoin price dropped to $28,100, and in 2023, it declined slightly further to around $26,800. These years represent the contraction phase of the market cycle, where prices pulled back after the previous expansion.
Recovery and New High Average Prices
The chart then shows a strong recovery phase. In 2024, the average Bitcoin price rose again to around $60,500, indicating the start of a new expansion period.
By 2025, the average yearly price reached approximately $92,000, the highest level shown on the chart and a significant increase compared to all previous years.
Long-Term Trend Remains Clearly Upward
Looking at the full period from 2016 to 2025, the chart shows a consistent long-term trend: despite major corrections and bear markets, each cycle has resulted in a higher average yearly price than the previous one.
The data highlights that while Bitcoin experiences strong volatility in the short term, the long-term trend across multiple cycles has been defined by rising average price levels over time.
The post Bitcoin’s Yearly Average Price Shows the Bigger Picture Behind Market Cycles appeared first on ETHNews.


You May Also Like

Japan’s Bond Shock Could Trigger the Next Global Crypto Sell-Off

ZETA up +10.55%, BTC +0.00%, Zebec Network is The Coin of The Day – Daily Market Update for Apr 05, 2026 | CoinCodex


