

Solana (SOL) Accumulates $136M in Weekly Inflows Despite Rising Wedge Warning
Quick Overview
- Crypto investment products attracted $230M in weekly inflows, with Bitcoin dominating at $219M
- Solana pulled in $17M during its seventh consecutive week of positive flows, reaching $136M total
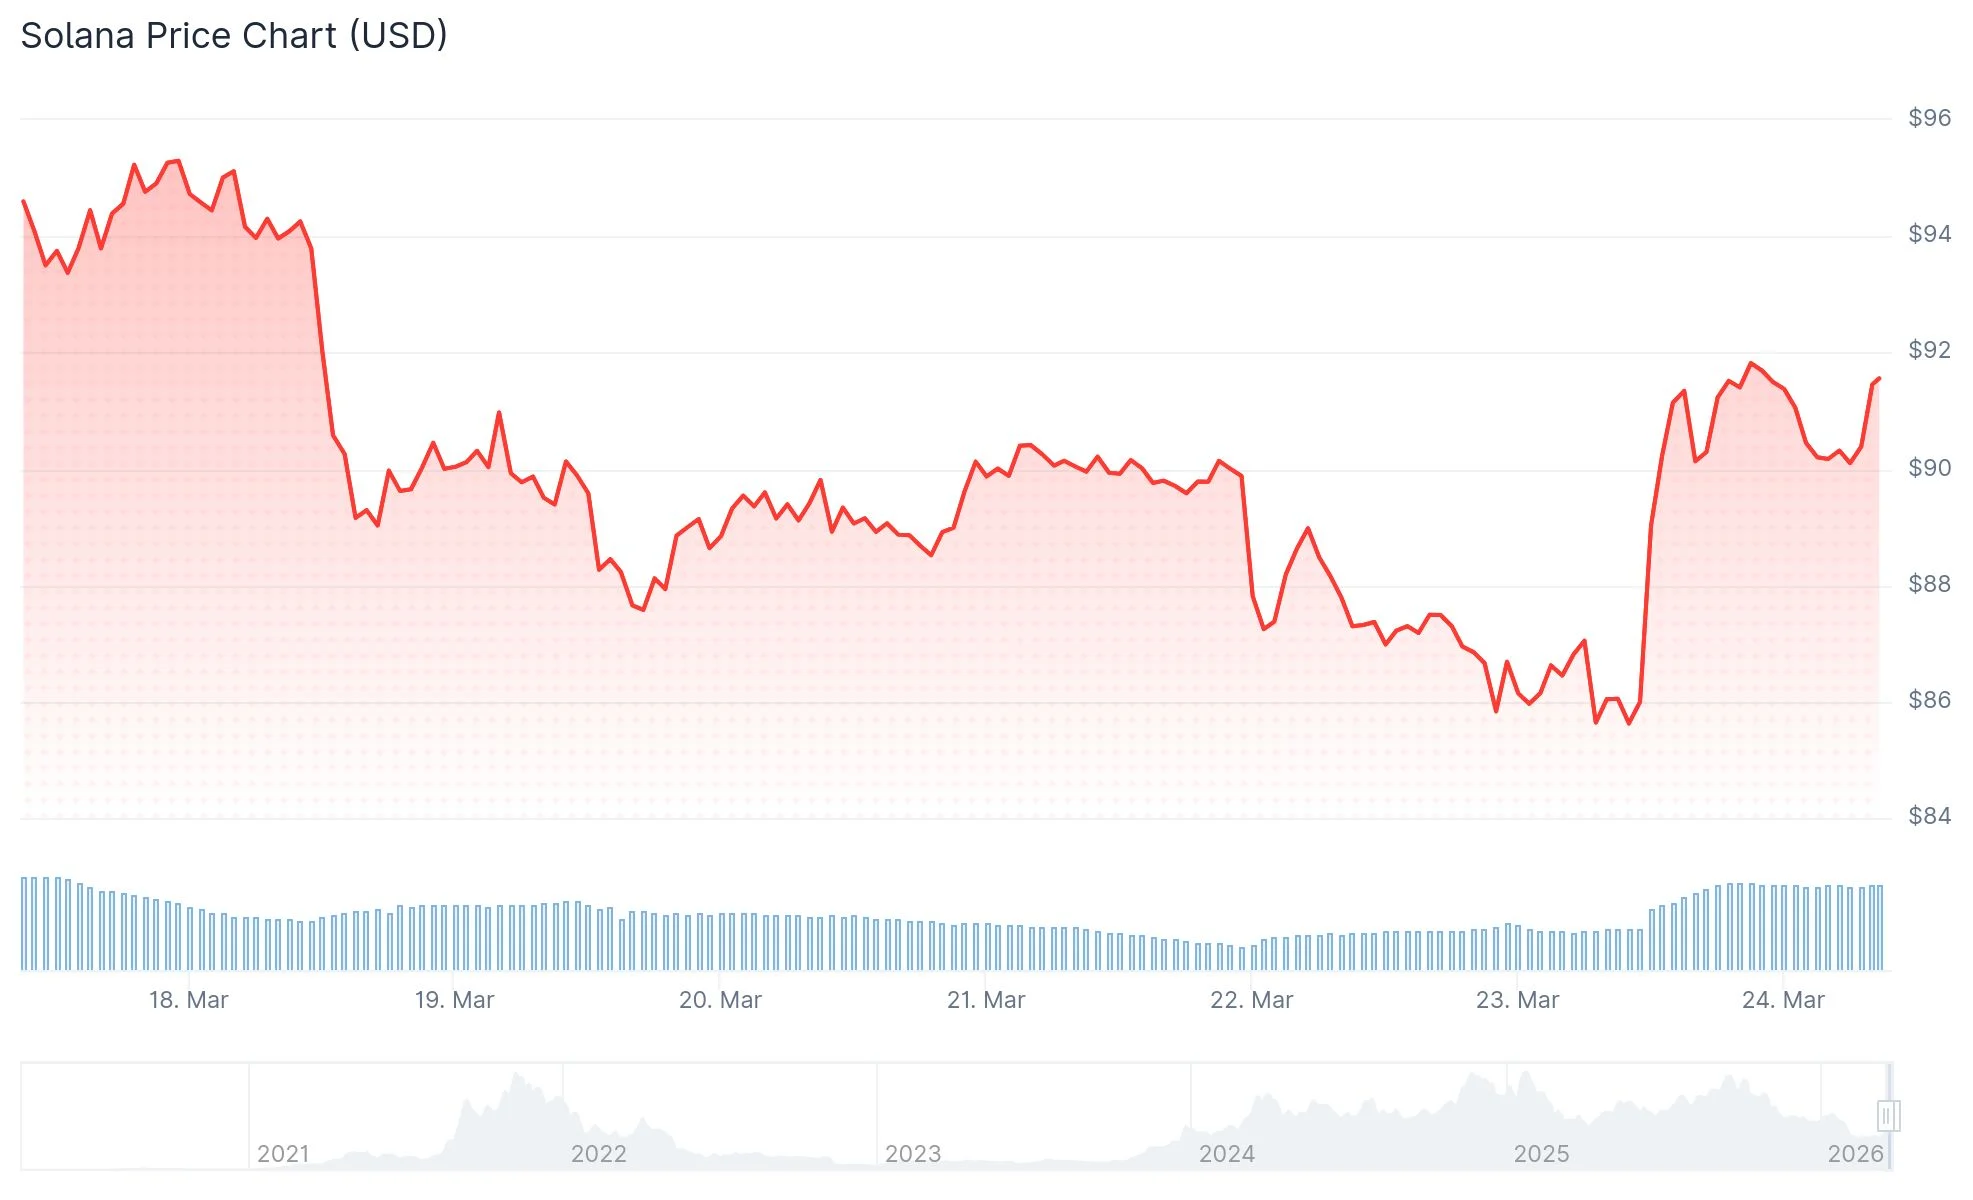
- SOL currently trades near $91–92, showing a 5.64% daily gain but a 3% weekly decline
- Technical analysis reveals a rising wedge formation on the 3-day timeframe, indicating possible continuation of downtrend
- Critical price zones: $78 as support level and $95 as resistance, with potential decline to $65–70 range
Solana (SOL) maintains its position in the lower $90 range following a brief uptick, though technical indicators suggest the rally may face challenges ahead.
 Solana (SOL) Price
Crypto investment vehicles recorded $230M in aggregate inflows during the previous week, based on CoinShares reporting. Initial trading days showed robust momentum with $635M flowing in, but market sentiment reversed following the Federal Reserve’s policy announcement, resulting in $405M of outflows midweek.
The United States dominated regional capital flows with $153M. Germany recorded $30.2M in additions while Switzerland accounted for $27.5M.
Bitcoin captured the lion’s share of investment interest with $219M in inflows. Ethereum experienced $27.5M in withdrawals, ending its three-week run of positive momentum.
Solana secured $17M in inflows during the most recent week, marking its seventh straight week of net positive flows. The cumulative total across this period now stands at $136M.
SOL was trading at $91.61 as of press time, reflecting a 5.64% increase over the previous 24-hour period. The daily advance notwithstanding, the token remains approximately 3% lower compared to seven days prior.
Rising Wedge Pattern Triggers Caution
Market analyst CryptoBullet identified a rising wedge structure developing on Solana’s 3-day price chart. This technical formation emerged following SOL’s breach below its 200-week moving average, a metric frequently referenced for assessing macro trend health.
Successive rebounds inside the wedge structure display diminishing strength. This behavior indicates buying pressure is gradually fading. A rising wedge pattern that forms after significant price deterioration typically foreshadows trend continuation to the downside.
Should SOL violate the lower boundary of the wedge, additional downside acceleration may materialize. Analyst DrBullZeus identifies $78 as the next support threshold, with breakdown scenarios potentially driving price action toward the $65–70 corridor.
Weekly Timeframe Presents Conflicting Indicators
Examining the weekly chart reveals the 100 and 200 exponential moving averages maintaining upward trajectories, representing constructive long-term structure. Conversely, the 20 and 50 EMAs have stalled, reflecting momentum deceleration.
Bollinger Bands display tight consolidation, a configuration that historically precedes significant directional moves. The Relative Strength Index hovers in the mid-30s — not yet in oversold territory but demonstrating sellers maintain control.
The MACD indicator continues operating in negative space, though diminishing histogram readings suggest selling intensity may be moderating incrementally.
Chainlink and Hyperliquid registered more modest inflow figures of $4.6M and $4.5M respectively throughout the week.
Regarding upside potential, a decisive move beyond $95 could propel SOL toward the $110–$120 range. Extended forecasts from analyst Moonbag project targets of $260–$300 contingent upon SOL recapturing the $180–$200 area.
The Balance of Power metric currently registers negative readings, with selling pressure maintaining the upper hand according to recent data.
The post Solana (SOL) Accumulates $136M in Weekly Inflows Despite Rising Wedge Warning appeared first on Blockonomi.


You May Also Like

Prediction markets get CFTC relief as legal battles widen

Metaplanet Stock: How a 24% Bitcoin Drop Erased Strong Operating Gains


