Silver has been on a… Well, a wild ride really, at least in the last few weeks. After exploding to nearly $120 in January, the white metal pulled back hard, bottomingSilver has been on a… Well, a wild ride really, at least in the last few weeks. After exploding to nearly $120 in January, the white metal pulled back hard, bottoming

Silver Price Prediction: Correction Structure Changed, But $150 Target Stays

2026/03/25 03:00
3 min read
For feedback or concerns regarding this content, please contact us at [email protected]

Silver has been on a… Well, a wild ride really, at least in the last few weeks. After exploding to nearly $120 in January, the white metal pulled back hard, bottoming near $64 before recovering to the $68 level. For traders watching the correction, the price action has been confusing, but one analyst says the structural details don’t change the final destination.

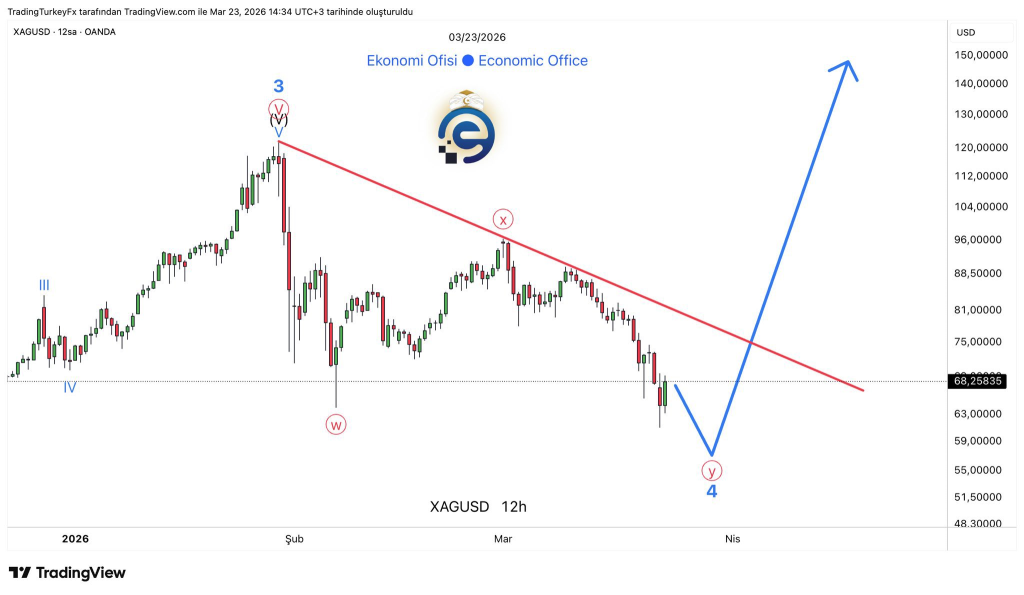
Economic Office, a technical analyst who tracks commodities closely, shared a detailed 12‑hour chart showing silver’s wave count. His message is simple: the structure of the correction has changed, but the $150 target remains firmly in place.

Silver Chart Analysis

Economic Office’s chart lays out silver’s move from the 2025 lows using Elliott Wave theory. According to his count, silver completed a powerful Wave 3 rally that topped near $120. What followed was a Wave 4 correction; a period of consolidation before the next impulsive leg higher.

Initially, he expected the correction to take the form of a triangle pattern. But price action has shifted. The chart now shows a W‑X‑Y structure, which is a more complex corrective formation.

Source: X/@Economic_Office

Here’s how it breaks down on the 12‑hour chart:

  • Wave W completed first. That was the initial drop from the $120 peak down to the $64 low.
  • Wave X followed, bringing a recovery bounce back toward the $80‑$85 zone.
  • Wave Y is now playing out as the final leg of the correction. This wave is currently unfolding and could bring silver down to test the previous low or form a higher low before Wave 4 ends.

The chart labels these moves clearly, showing the W‑X‑Y progression across March. The key takeaway: Wave 4 is not over yet, but it is in its final stage.

Read also: Gold and Silver Wipe Out $2 Trillion in Just Hours – What’s Really Happening?

Silver Price Forecast

Once Wave 4 completes, Economic Office expects Wave 5 to begin. Wave 5 is the final impulse wave in the larger cycle, and his target for that move is $150.

The chart shows this target clearly marked. It aligns with historical resistance zones from previous cycles and represents a major breakout above the January highs.

The analyst explains that while the correction structure may have changed (from a simple triangle to a more complex W‑X‑Y) the ultimate price objective has not moved. As long as the structure holds and the wave count remains valid, $150 stays the target.

He notes that the change of the correction matters for timing and entries, but not for the final outcome. For traders, the current silver price at $68 level might represent the final leg of the correction. If Wave Y plays out as expected, silver could see one more dip before turning decisively higher toward $150.

The chart’s annotation says it clearly: the target does not change. And for those willing to look past the short‑term noise, the setup points to a major move ahead.

Subscribe to our YouTube channel for daily crypto updates, market insights, and expert analysis.

The post Silver Price Prediction: Correction Structure Changed, But $150 Target Stays appeared first on CaptainAltcoin.

Market Opportunity
Whiterock Logo
Whiterock Price(WHITE)
$0.00008082
$0.00008082$0.00008082
+2.01%
USD
Whiterock (WHITE) Live Price Chart
Disclaimer: The articles reposted on this site are sourced from public platforms and are provided for informational purposes only. They do not necessarily reflect the views of MEXC. All rights remain with the original authors. If you believe any content infringes on third-party rights, please contact [email protected] for removal. MEXC makes no guarantees regarding the accuracy, completeness, or timeliness of the content and is not responsible for any actions taken based on the information provided. The content does not constitute financial, legal, or other professional advice, nor should it be considered a recommendation or endorsement by MEXC.

You May Also Like

Is Putnam Global Technology A (PGTAX) a strong mutual fund pick right now?

Is Putnam Global Technology A (PGTAX) a strong mutual fund pick right now?

The post Is Putnam Global Technology A (PGTAX) a strong mutual fund pick right now? appeared on BitcoinEthereumNews.com. On the lookout for a Sector – Tech fund? Starting with Putnam Global Technology A (PGTAX – Free Report) should not be a possibility at this time. PGTAX possesses a Zacks Mutual Fund Rank of 4 (Sell), which is based on various forecasting factors like size, cost, and past performance. Objective We note that PGTAX is a Sector – Tech option, and this area is loaded with many options. Found in a wide number of industries such as semiconductors, software, internet, and networking, tech companies are everywhere. Thus, Sector – Tech mutual funds that invest in technology let investors own a stake in a notoriously volatile sector, but with a much more diversified approach. History of fund/manager Putnam Funds is based in Canton, MA, and is the manager of PGTAX. The Putnam Global Technology A made its debut in January of 2009 and PGTAX has managed to accumulate roughly $650.01 million in assets, as of the most recently available information. The fund is currently managed by Di Yao who has been in charge of the fund since December of 2012. Performance Obviously, what investors are looking for in these funds is strong performance relative to their peers. PGTAX has a 5-year annualized total return of 14.46%, and is in the middle third among its category peers. But if you are looking for a shorter time frame, it is also worth looking at its 3-year annualized total return of 27.02%, which places it in the middle third during this time-frame. It is important to note that the product’s returns may not reflect all its expenses. Any fees not reflected would lower the returns. Total returns do not reflect the fund’s [%] sale charge. If sales charges were included, total returns would have been lower. When looking at a fund’s performance, it…
Share
BitcoinEthereumNews2025/09/18 04:05
Circle Expands USDC Into Africa Through Sasai Deal, Targeting Cross-Border Payments Boom

Circle Expands USDC Into Africa Through Sasai Deal, Targeting Cross-Border Payments Boom

USDC integration into Sasai signals rising stablecoin demand for cross-border trade and FX stability in Africa. Circle Internet Group agreed to a landmark partnership
Share
LiveBitcoinNews2026/03/25 06:39
Wormhole Unleashes W 2.0 Tokenomics for a Connected Blockchain Future

Wormhole Unleashes W 2.0 Tokenomics for a Connected Blockchain Future

TLDR Wormhole reinvents W Tokenomics with Reserve, yield, and unlock upgrades. W Tokenomics: 4% yield, bi-weekly unlocks, and a sustainable Reserve Wormhole shifts to long-term value with treasury, yield, and smoother unlocks. Stakers earn 4% base yield as Wormhole optimizes unlocks for stability. Wormhole’s new Tokenomics align growth, yield, and stability for W holders. Wormhole [...] The post Wormhole Unleashes W 2.0 Tokenomics for a Connected Blockchain Future appeared first on CoinCentral.
Share
Coincentral2025/09/18 02:07